The Agulhas System Climate Array (ASCA) aims to improve our understanding of the role that the Agulhas Current plays in climate. The Agulhas Current is the western boundary current of the South Indian Ocean. It is strong and carries a large amount of heat. Because of this, it dominates the heat budget of the Indian Ocean, which impacts sea level rise, sea surface temperature, East African rainfall, and storm tracks. By measuring the temperature, conductivity, and velocity of the current, we will quantify the variability in Agulhas Current heat and freshwater transport and learn more about the links between the Agulhas Current and the climate system.
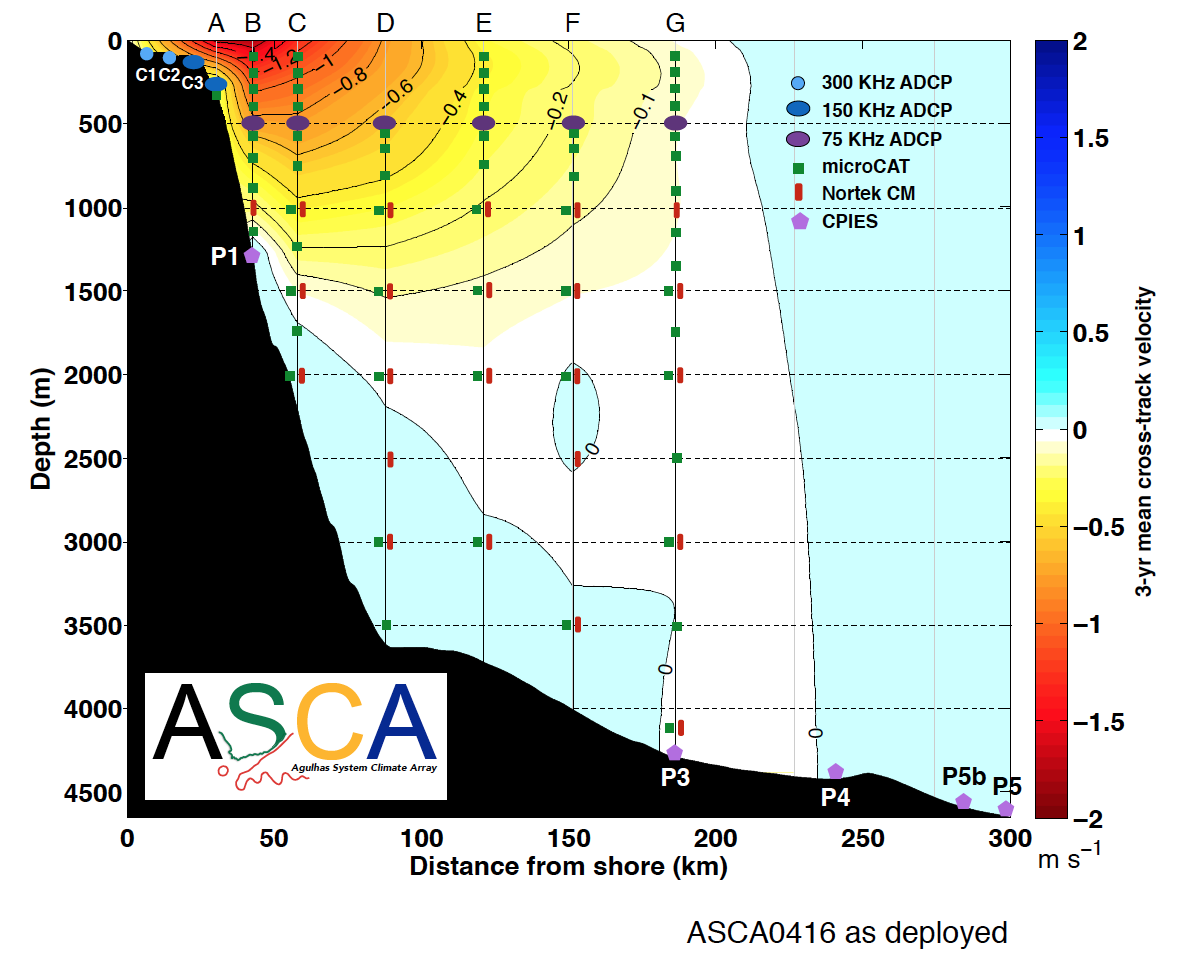
The Agulhas System Climate Array (ASCA) was deployed in April 2016 and recovered in June 2018. The array consisted of 7 tall moorings outfitted with acoustic doppler current profilers, current meters, and microCATs. These instruments measure current velocity, temperature, and conductivity. Five current and pressure recording inverted echo sounders were deployed to measure integrated volume and heat transport. For more information on these instruments, see the instrumentation page.
ASCA is a continuation and expansion of the Agulhas Current Time-series (ACT). ACT measured the velocity of the Agulhas Current, to resolve the volume transport over a three year period. However, it did not measure temperature or salinity. ASCA measures velocity, temperature, and salinity, and was designed to sufficiently resolve the volume, heat, and freshwater transports of the Agulhas Current.
Some of the questions that ASCA aims to answer are:
What is the relationship between volume and temperature transport of the Agulhas Current?
What is the seasonal variability of basin-wide overturning and heat transport of the Indian Ocean?
What mechanisms control the variability of basin-wide heat transport?
People & Collaboration
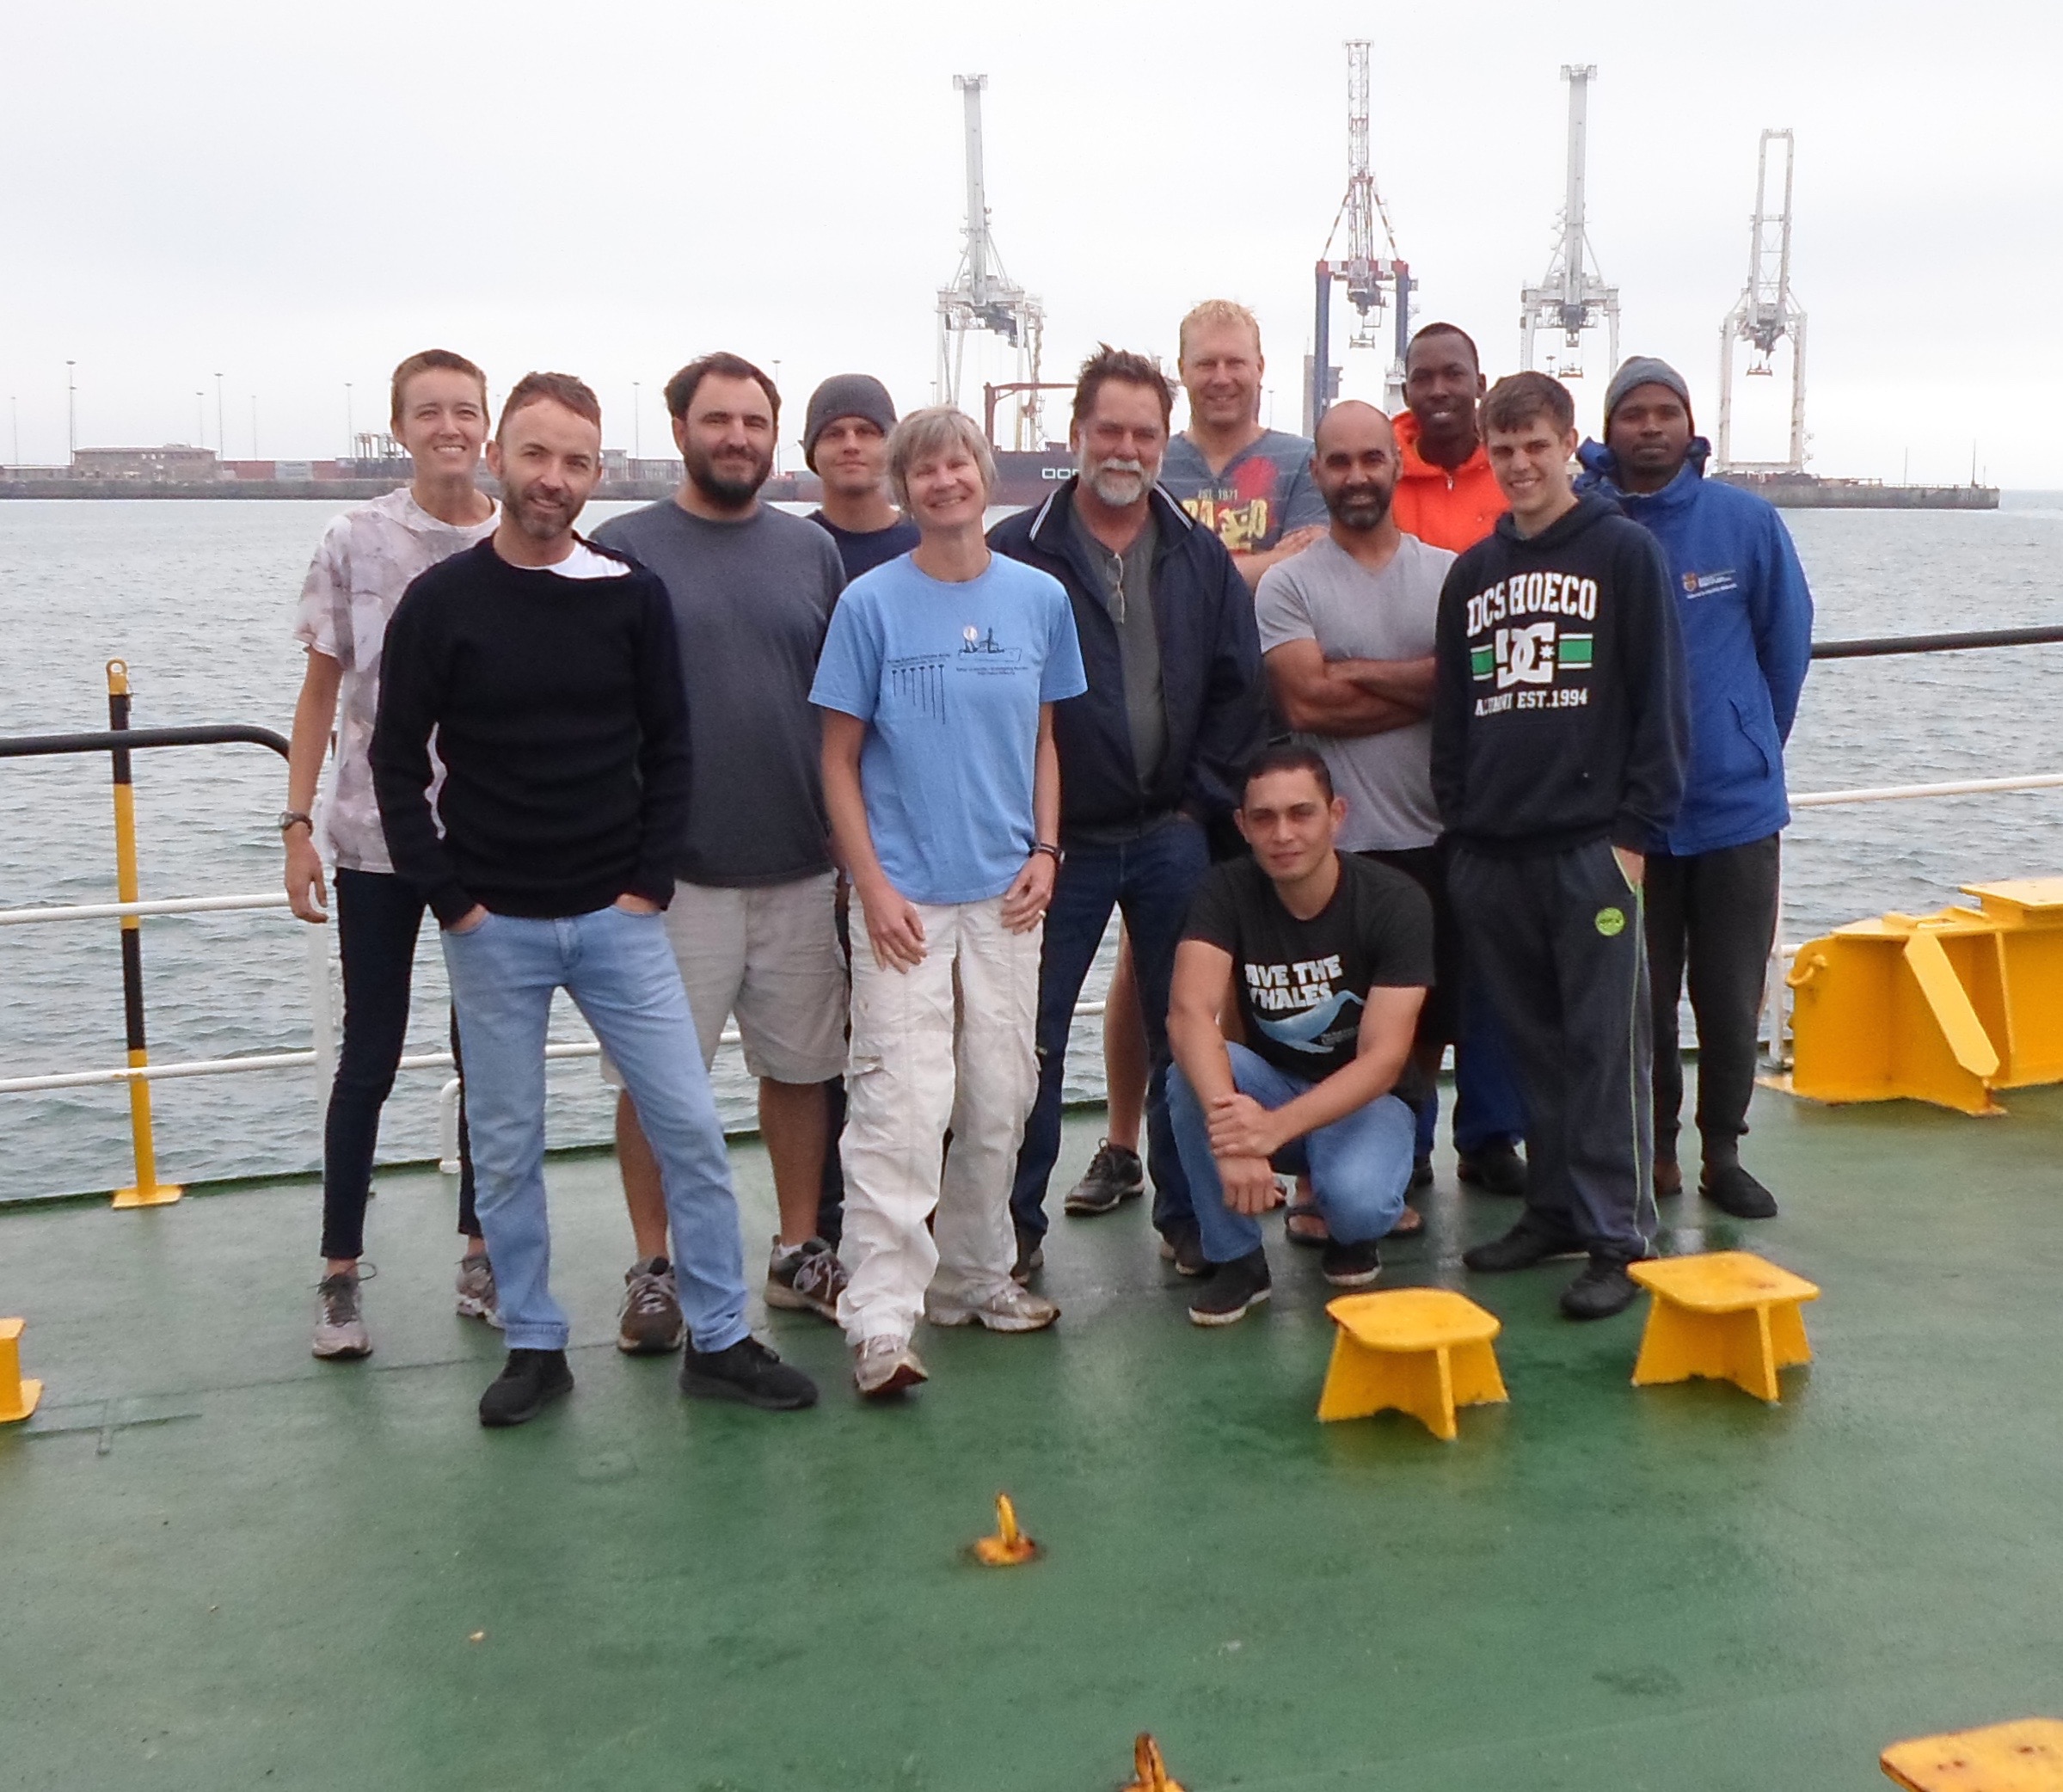
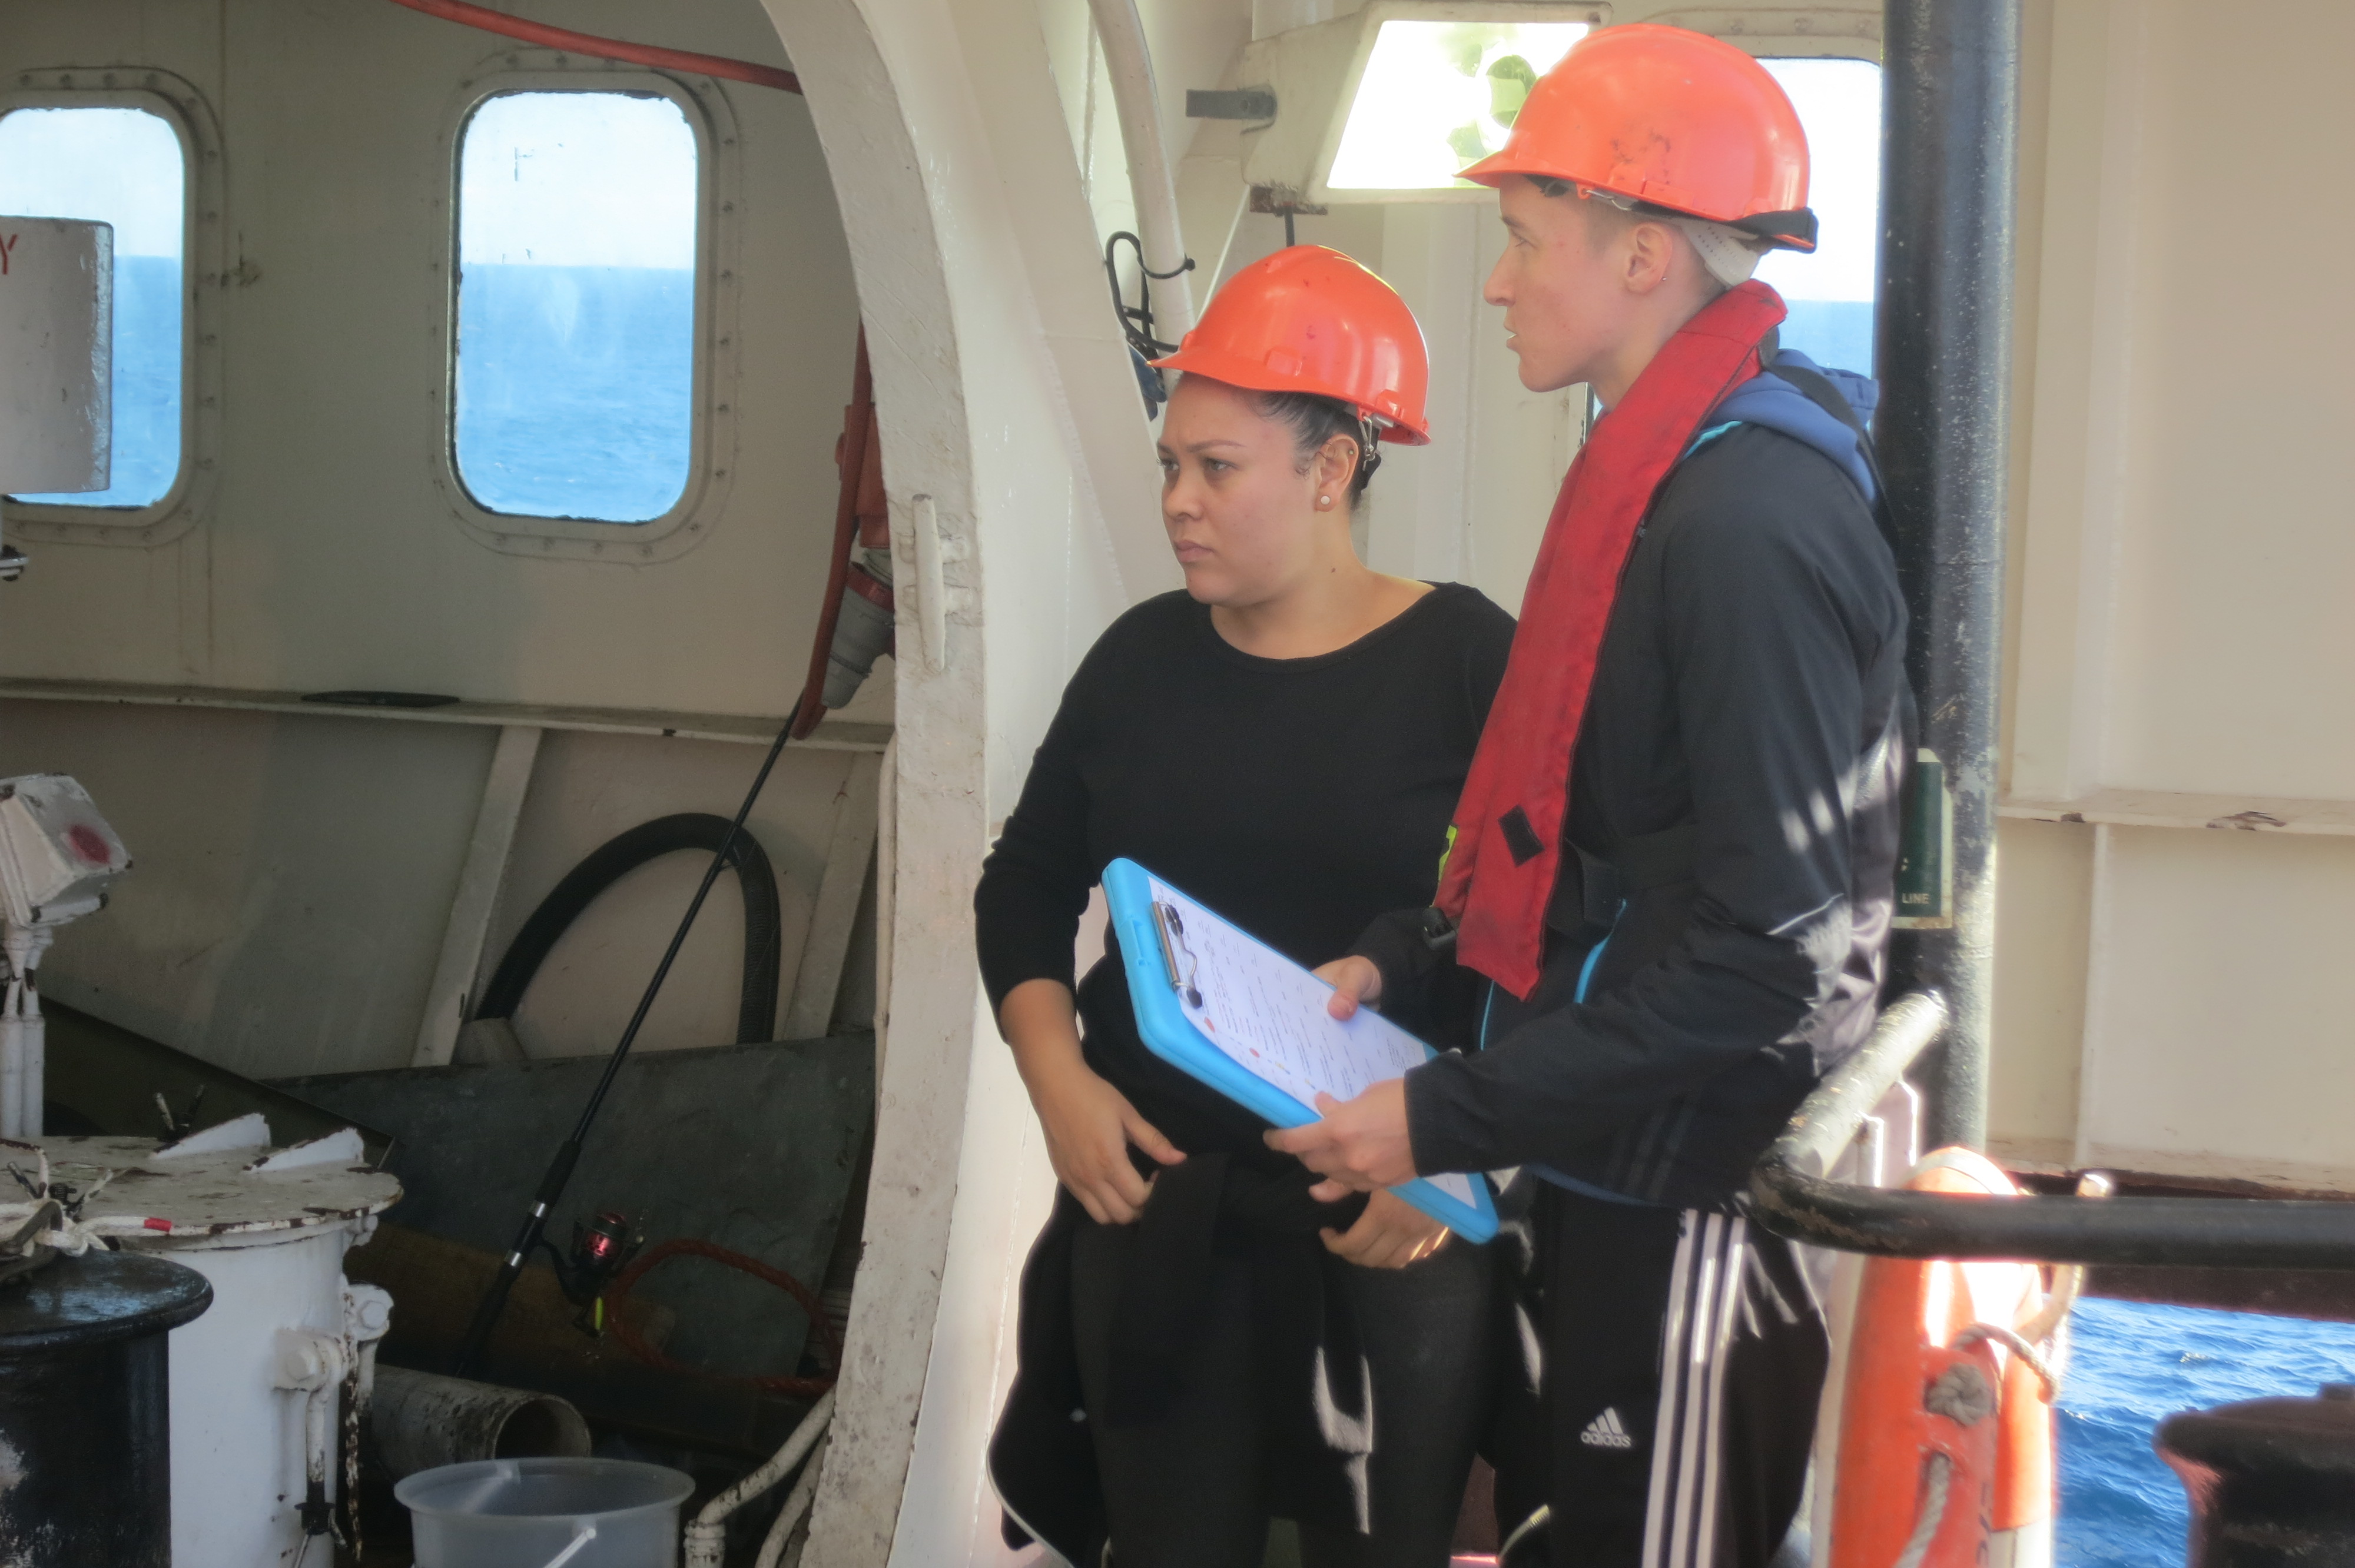
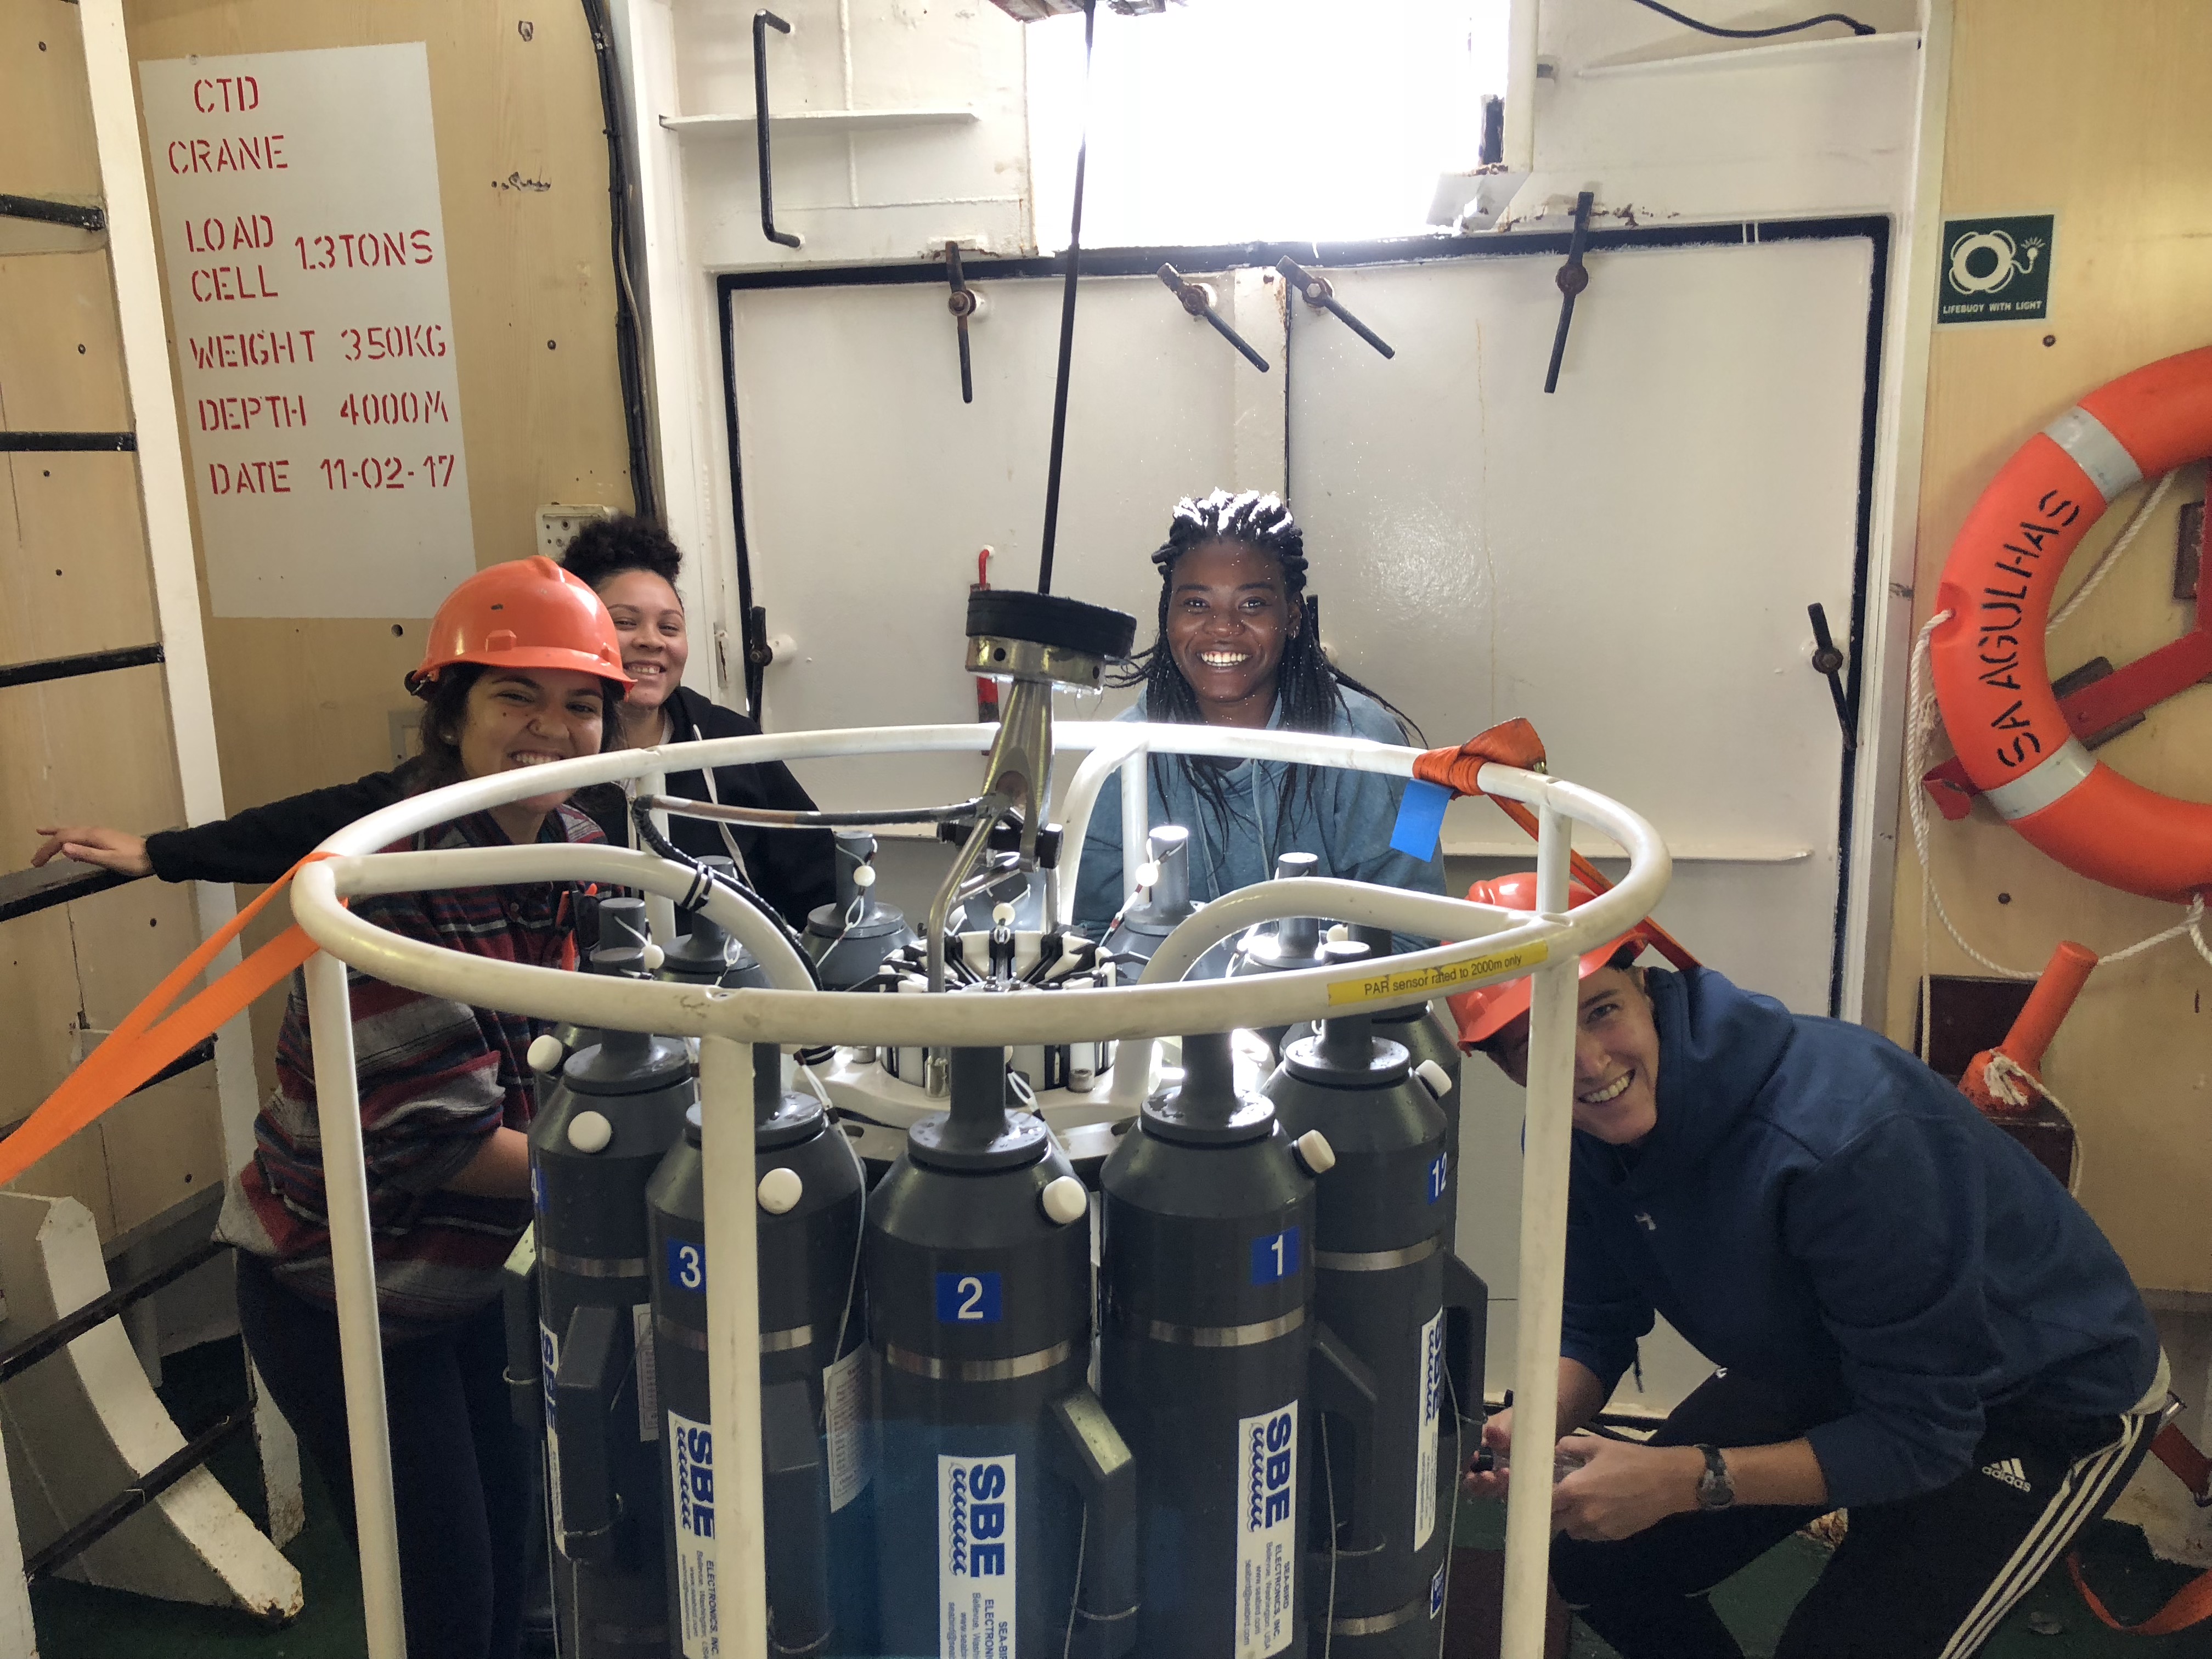
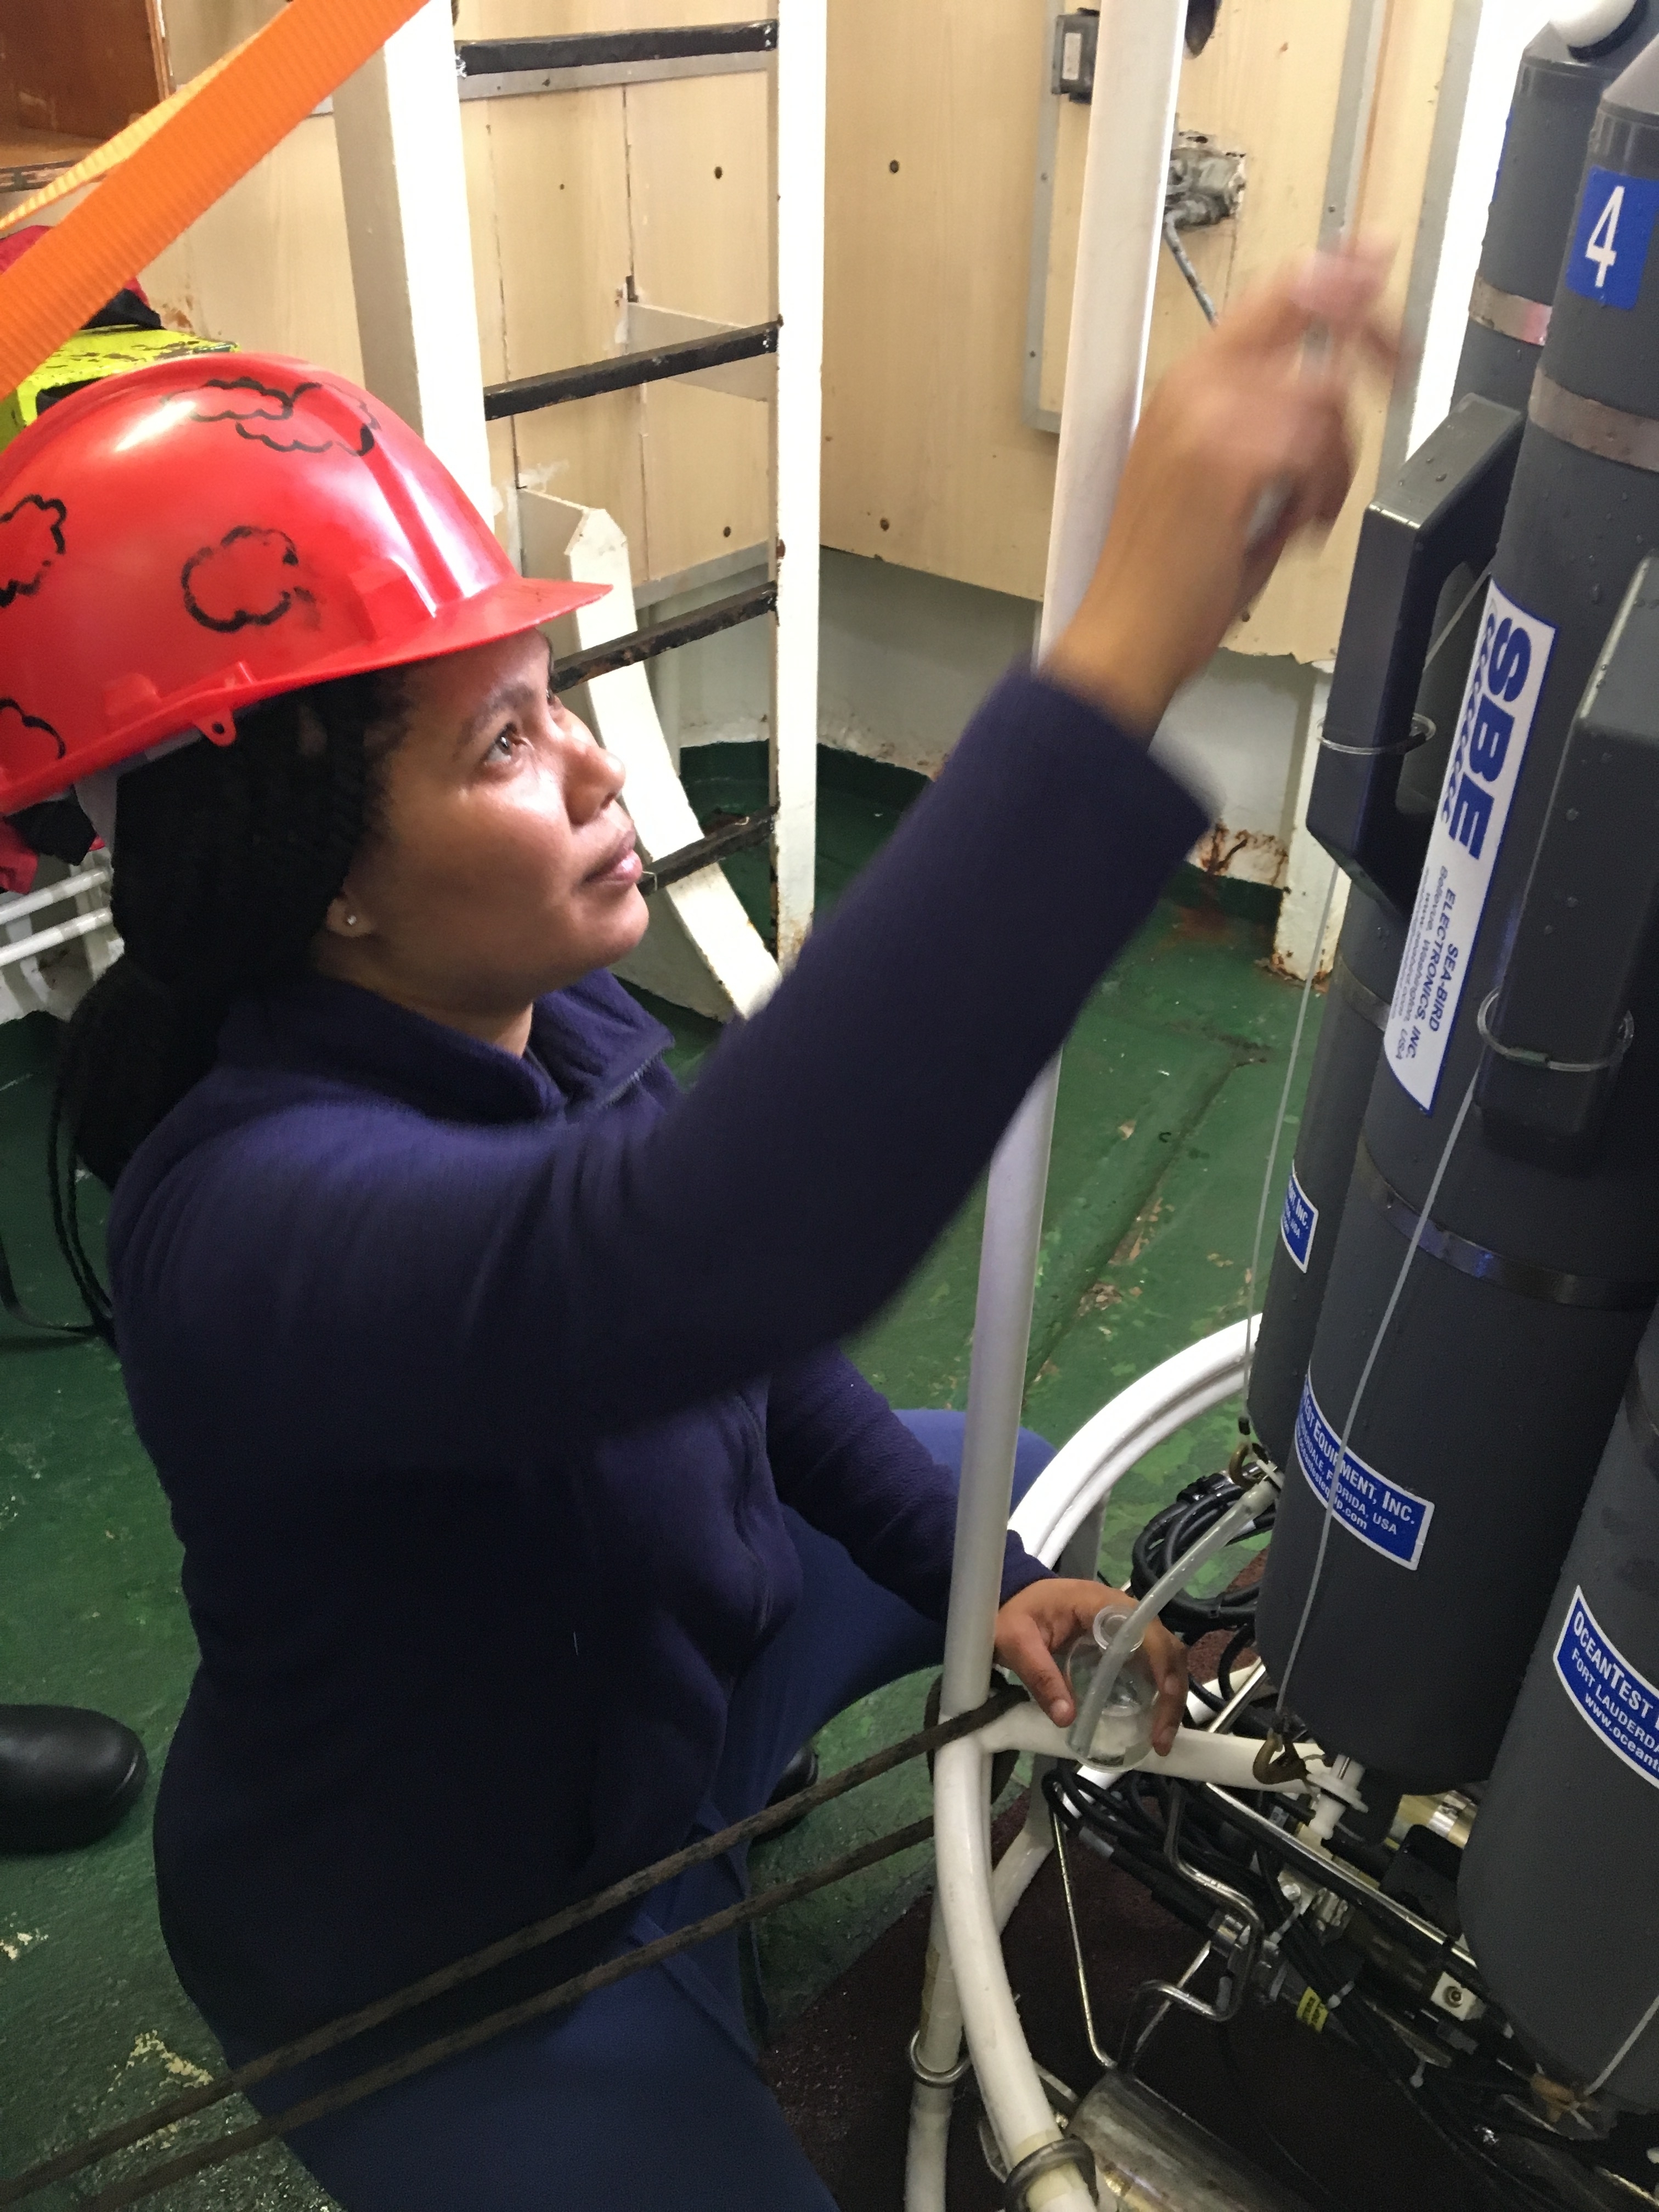
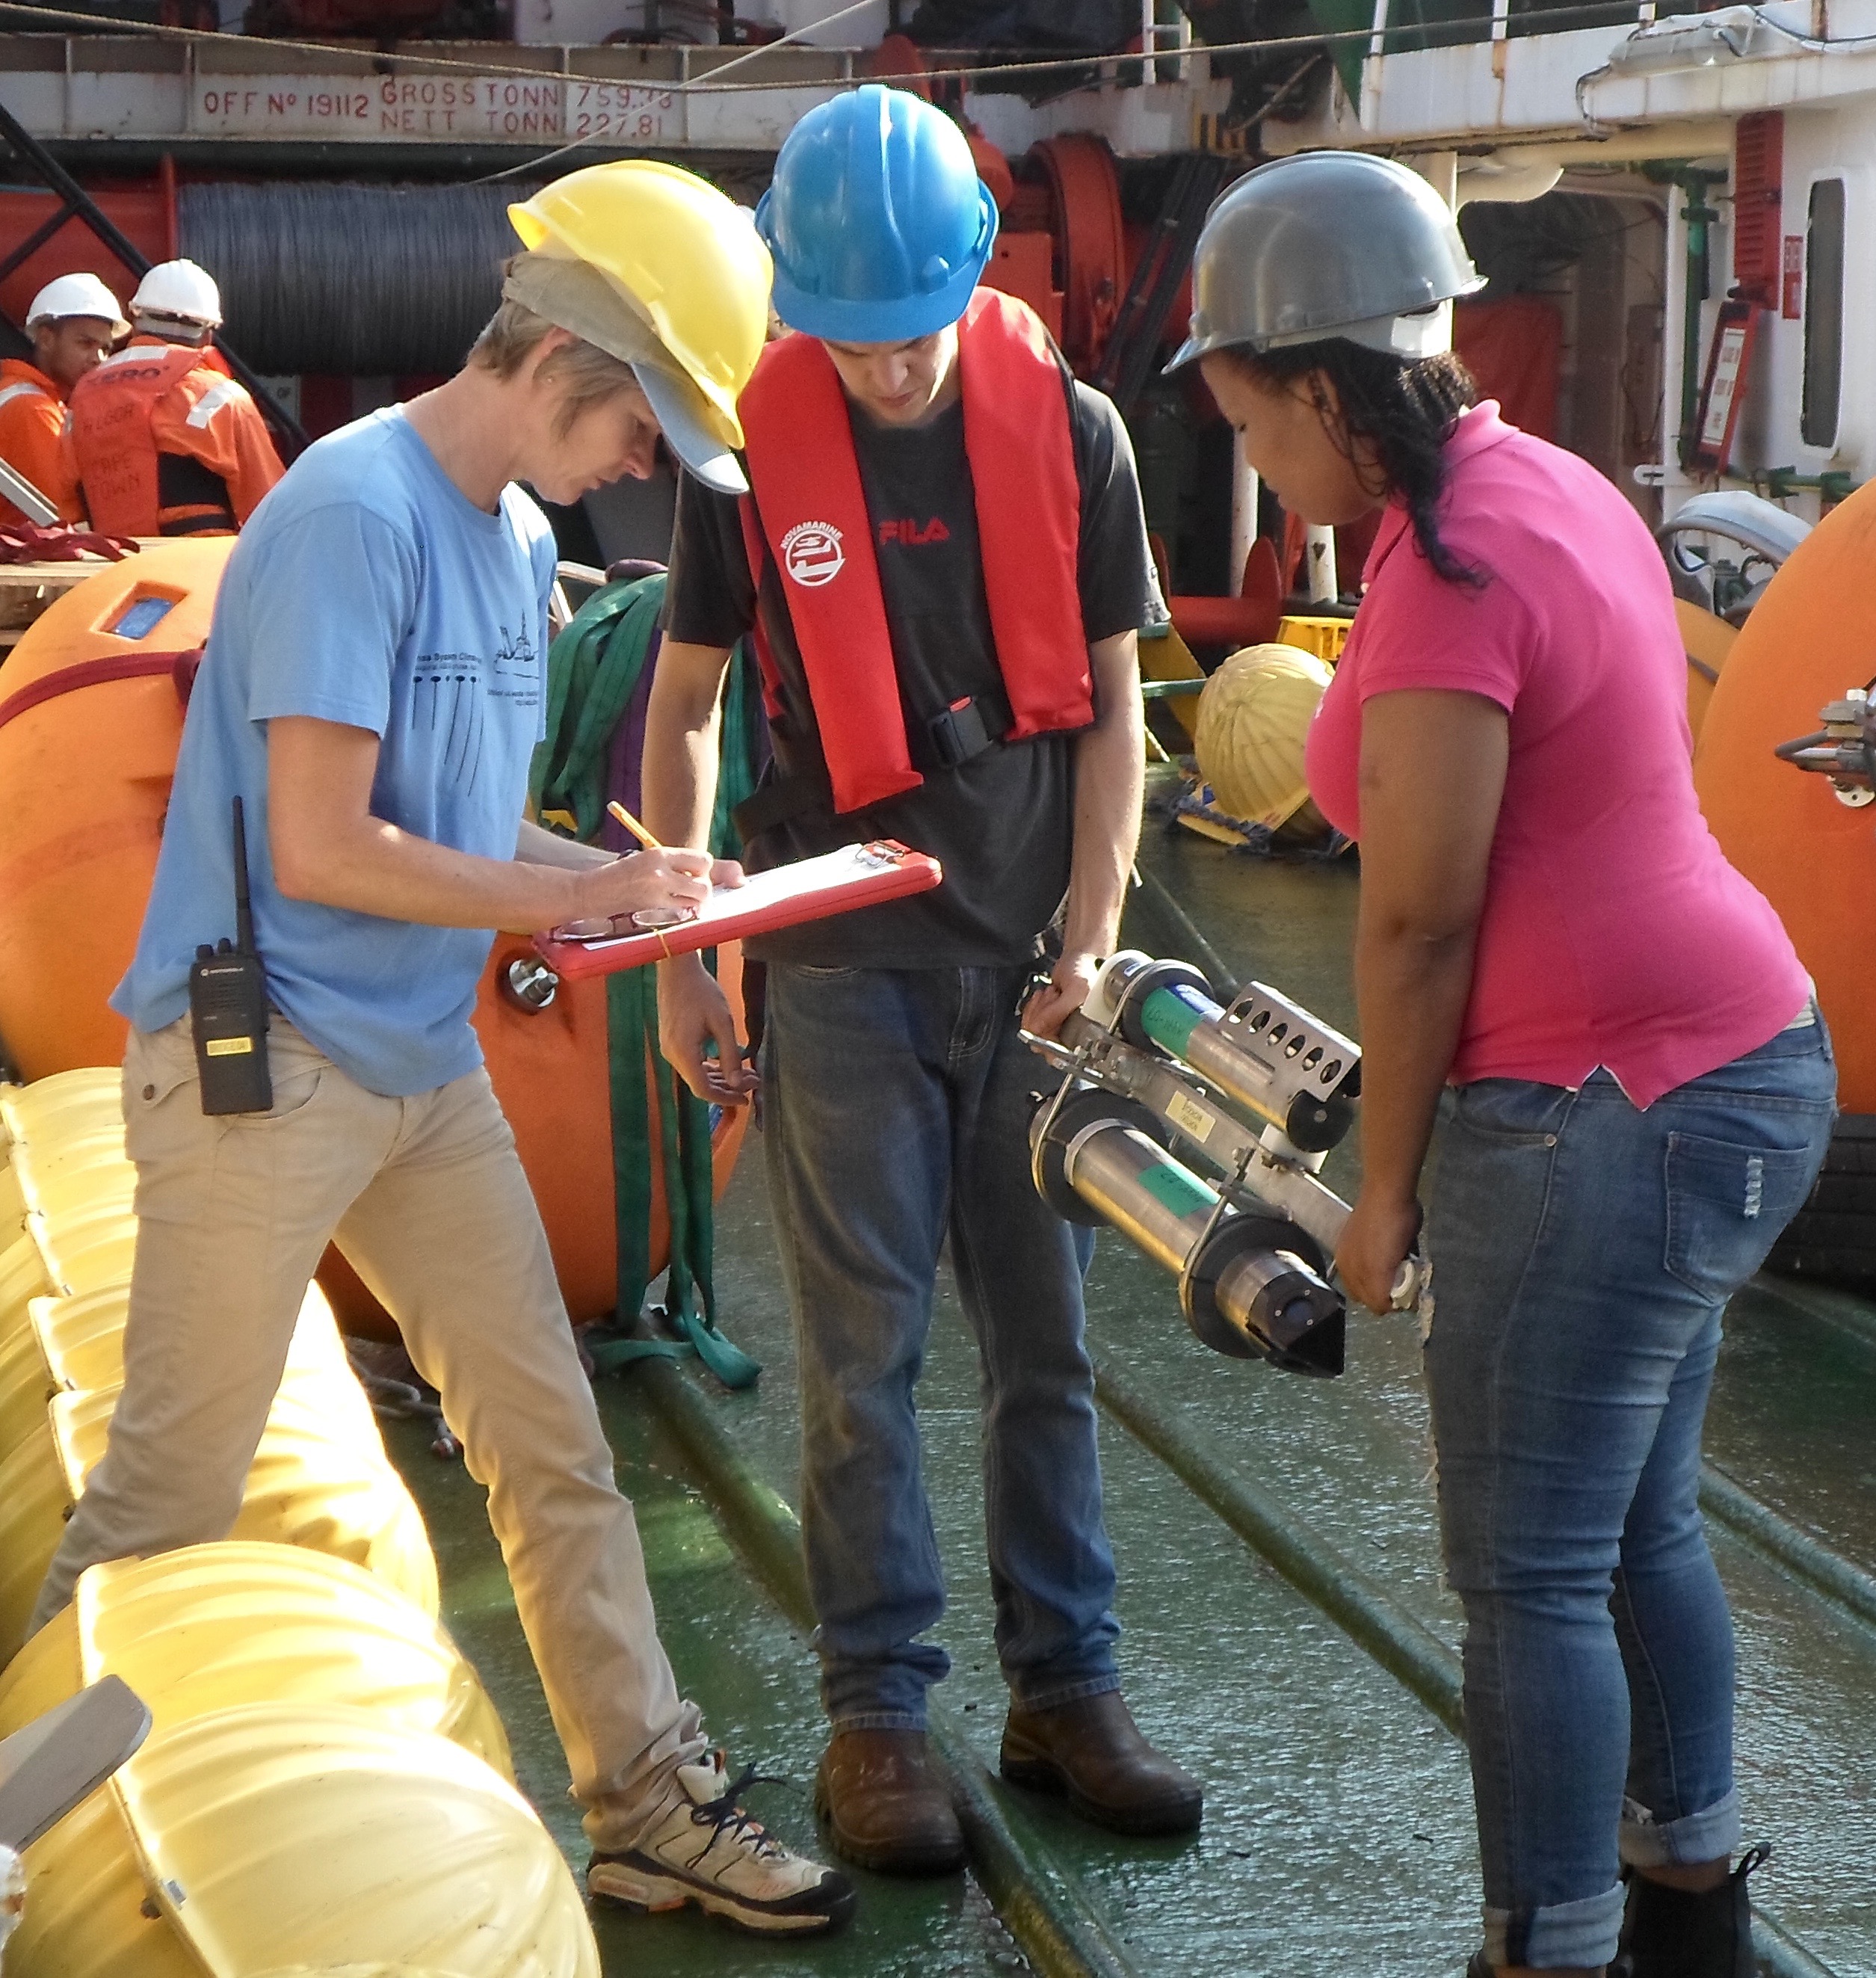
This project is a collaboration between the US, South Africa, and the Netherlands. An overview of the people involved with ASCA can be found on the South African ASCA website. The project also emphasized training and skills transfer between US, Dutch, and South African scientists. This included courses and workshops taught by Prof. Lisa Beal, Dr. Shane Elipot, Adam Houk, and K McMonigal.
The scientific party of the April 2016 ASCA cruise
Ongoing Research: Results, Data, and Publications
Since mooring recovery in June 2018, we have been working to calibrate, validate, interpret, and analyze the data from ASCA. This is a significant task due to the large number and varied types of instruments. Data products will be posted on the data products page when they become available.
Challenges
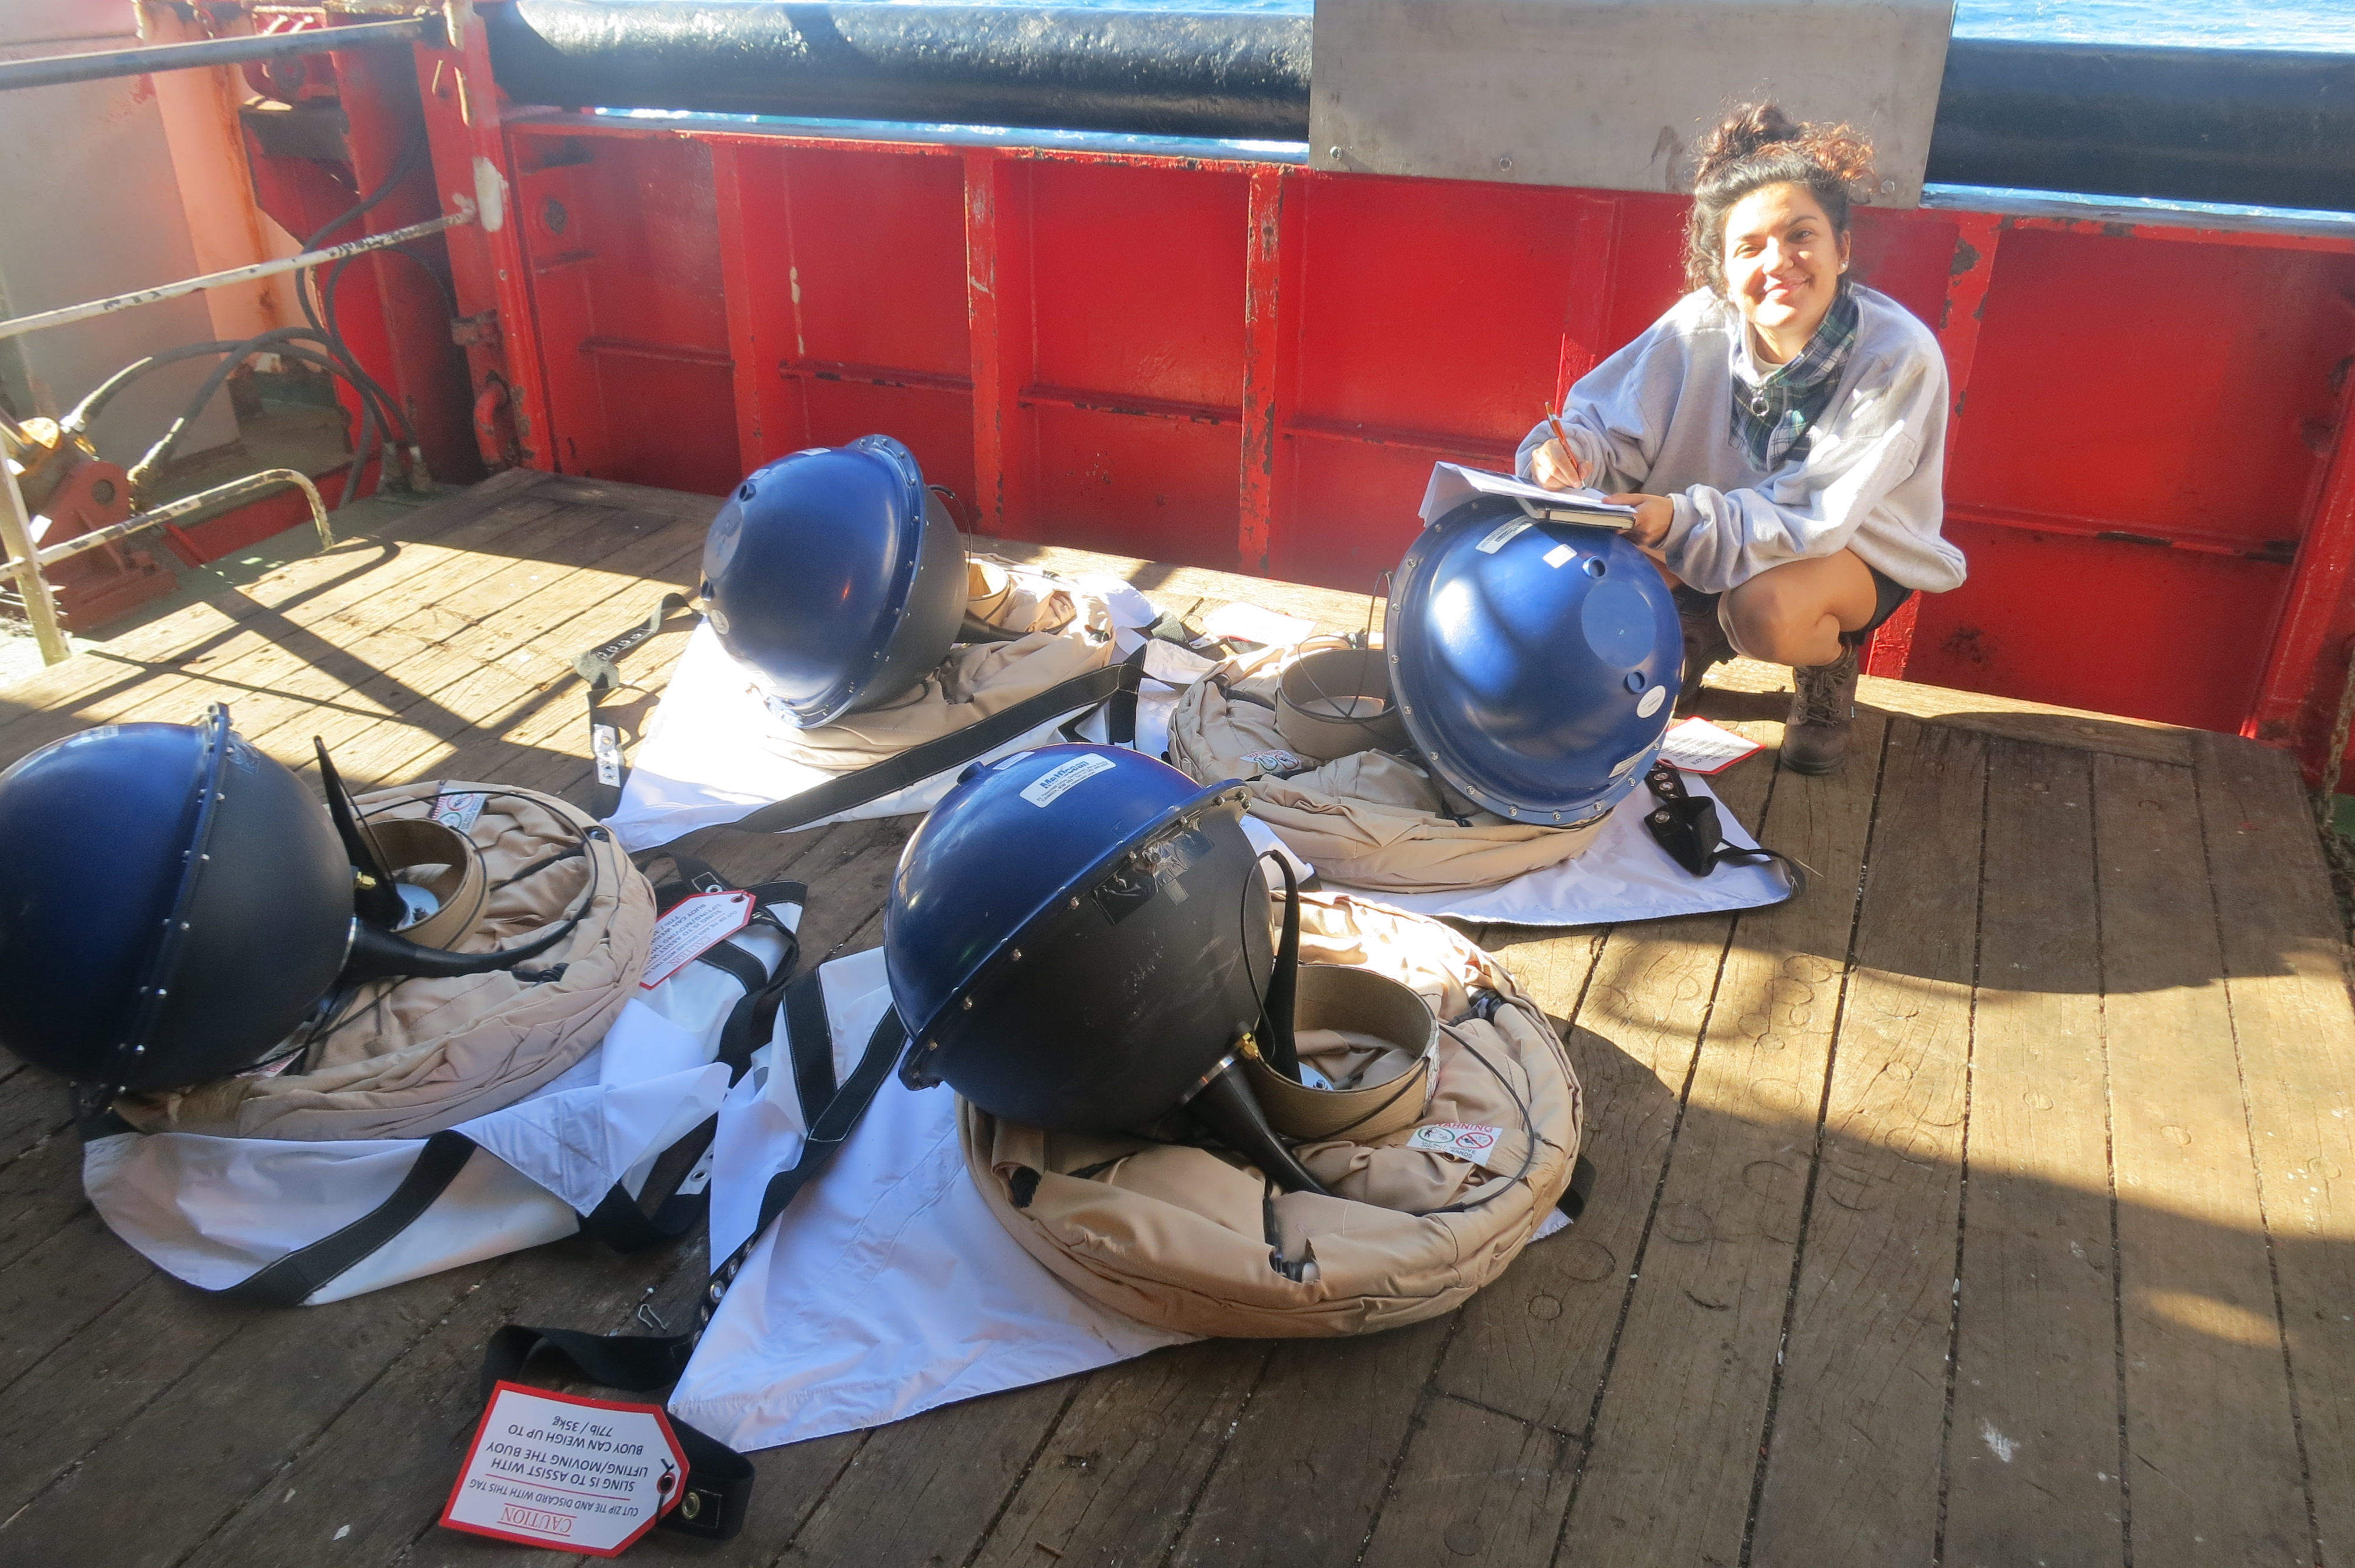
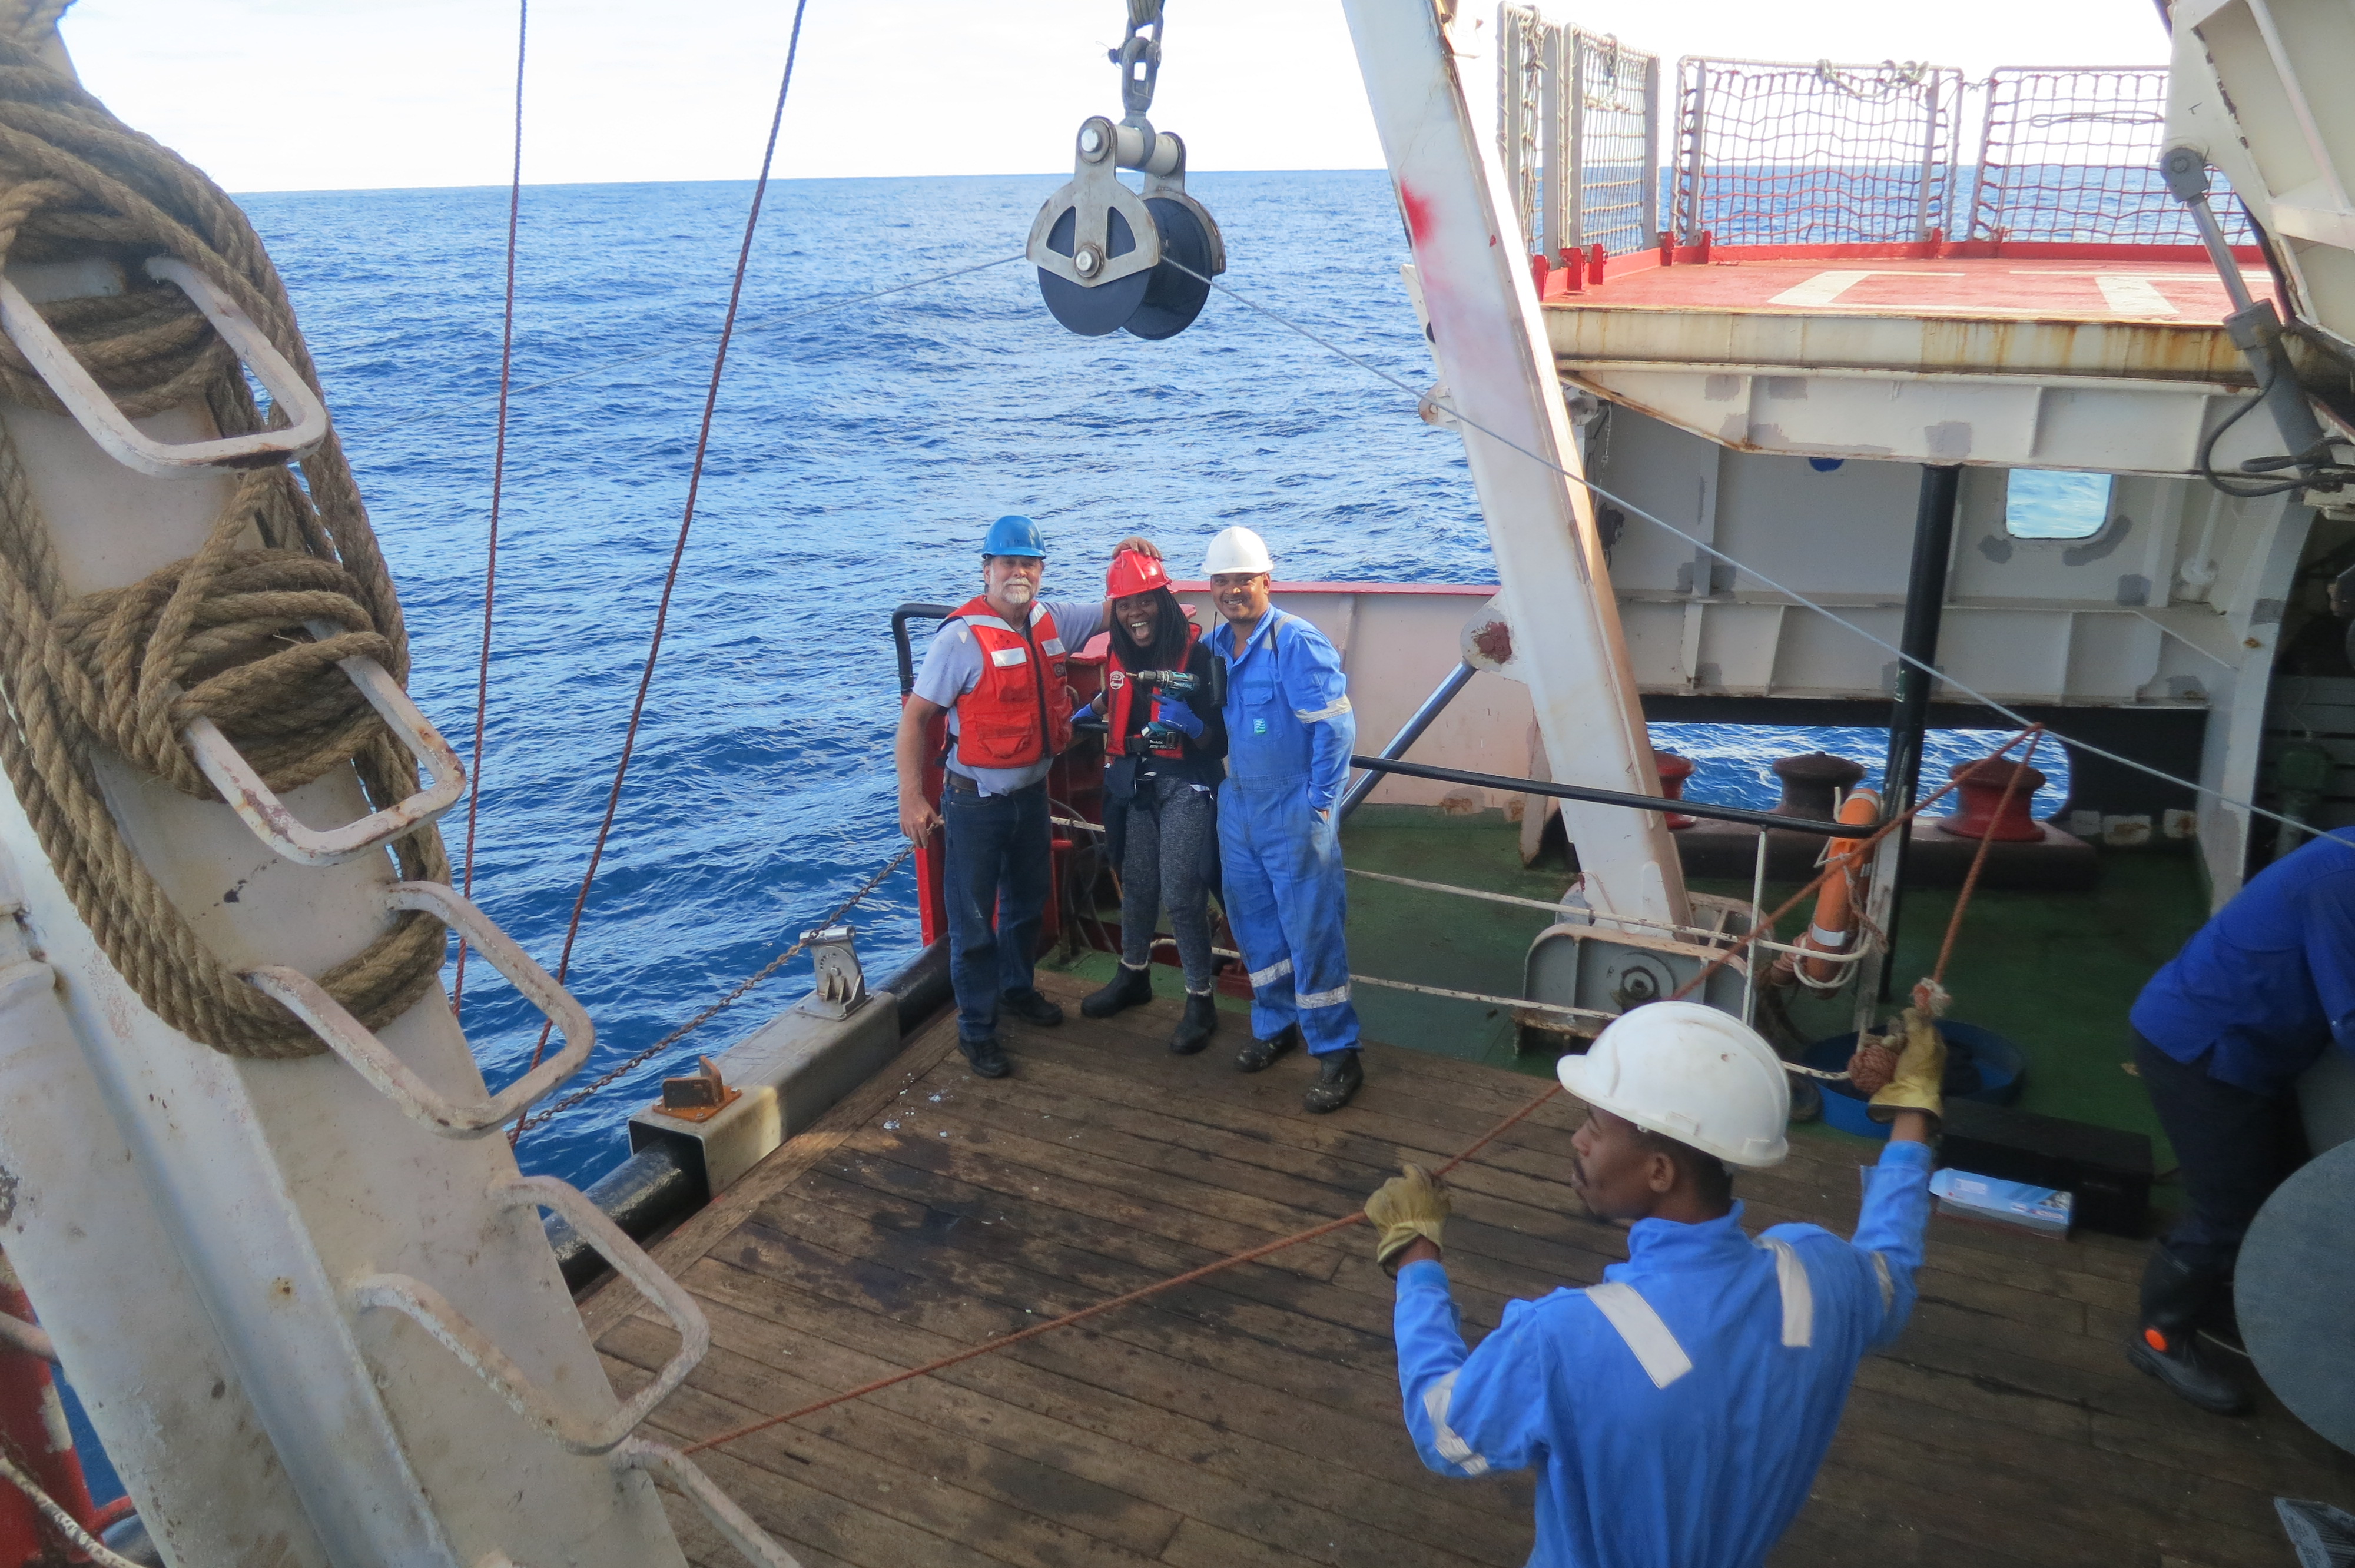
We deployed and recovered instruments from South African research vessels. Deploying instruments involves unspooling thousands of meters of wire and attaching instruments along the way, before dropping the anchor to hold the mooring in place. To recover moorings, we send a command to an acoustic release which disconnects the mooring from the anchor and allows it to come to the surface. The video below shows a time lapse of one of the ASCA mooring deployments. In real time, the process took several hours.
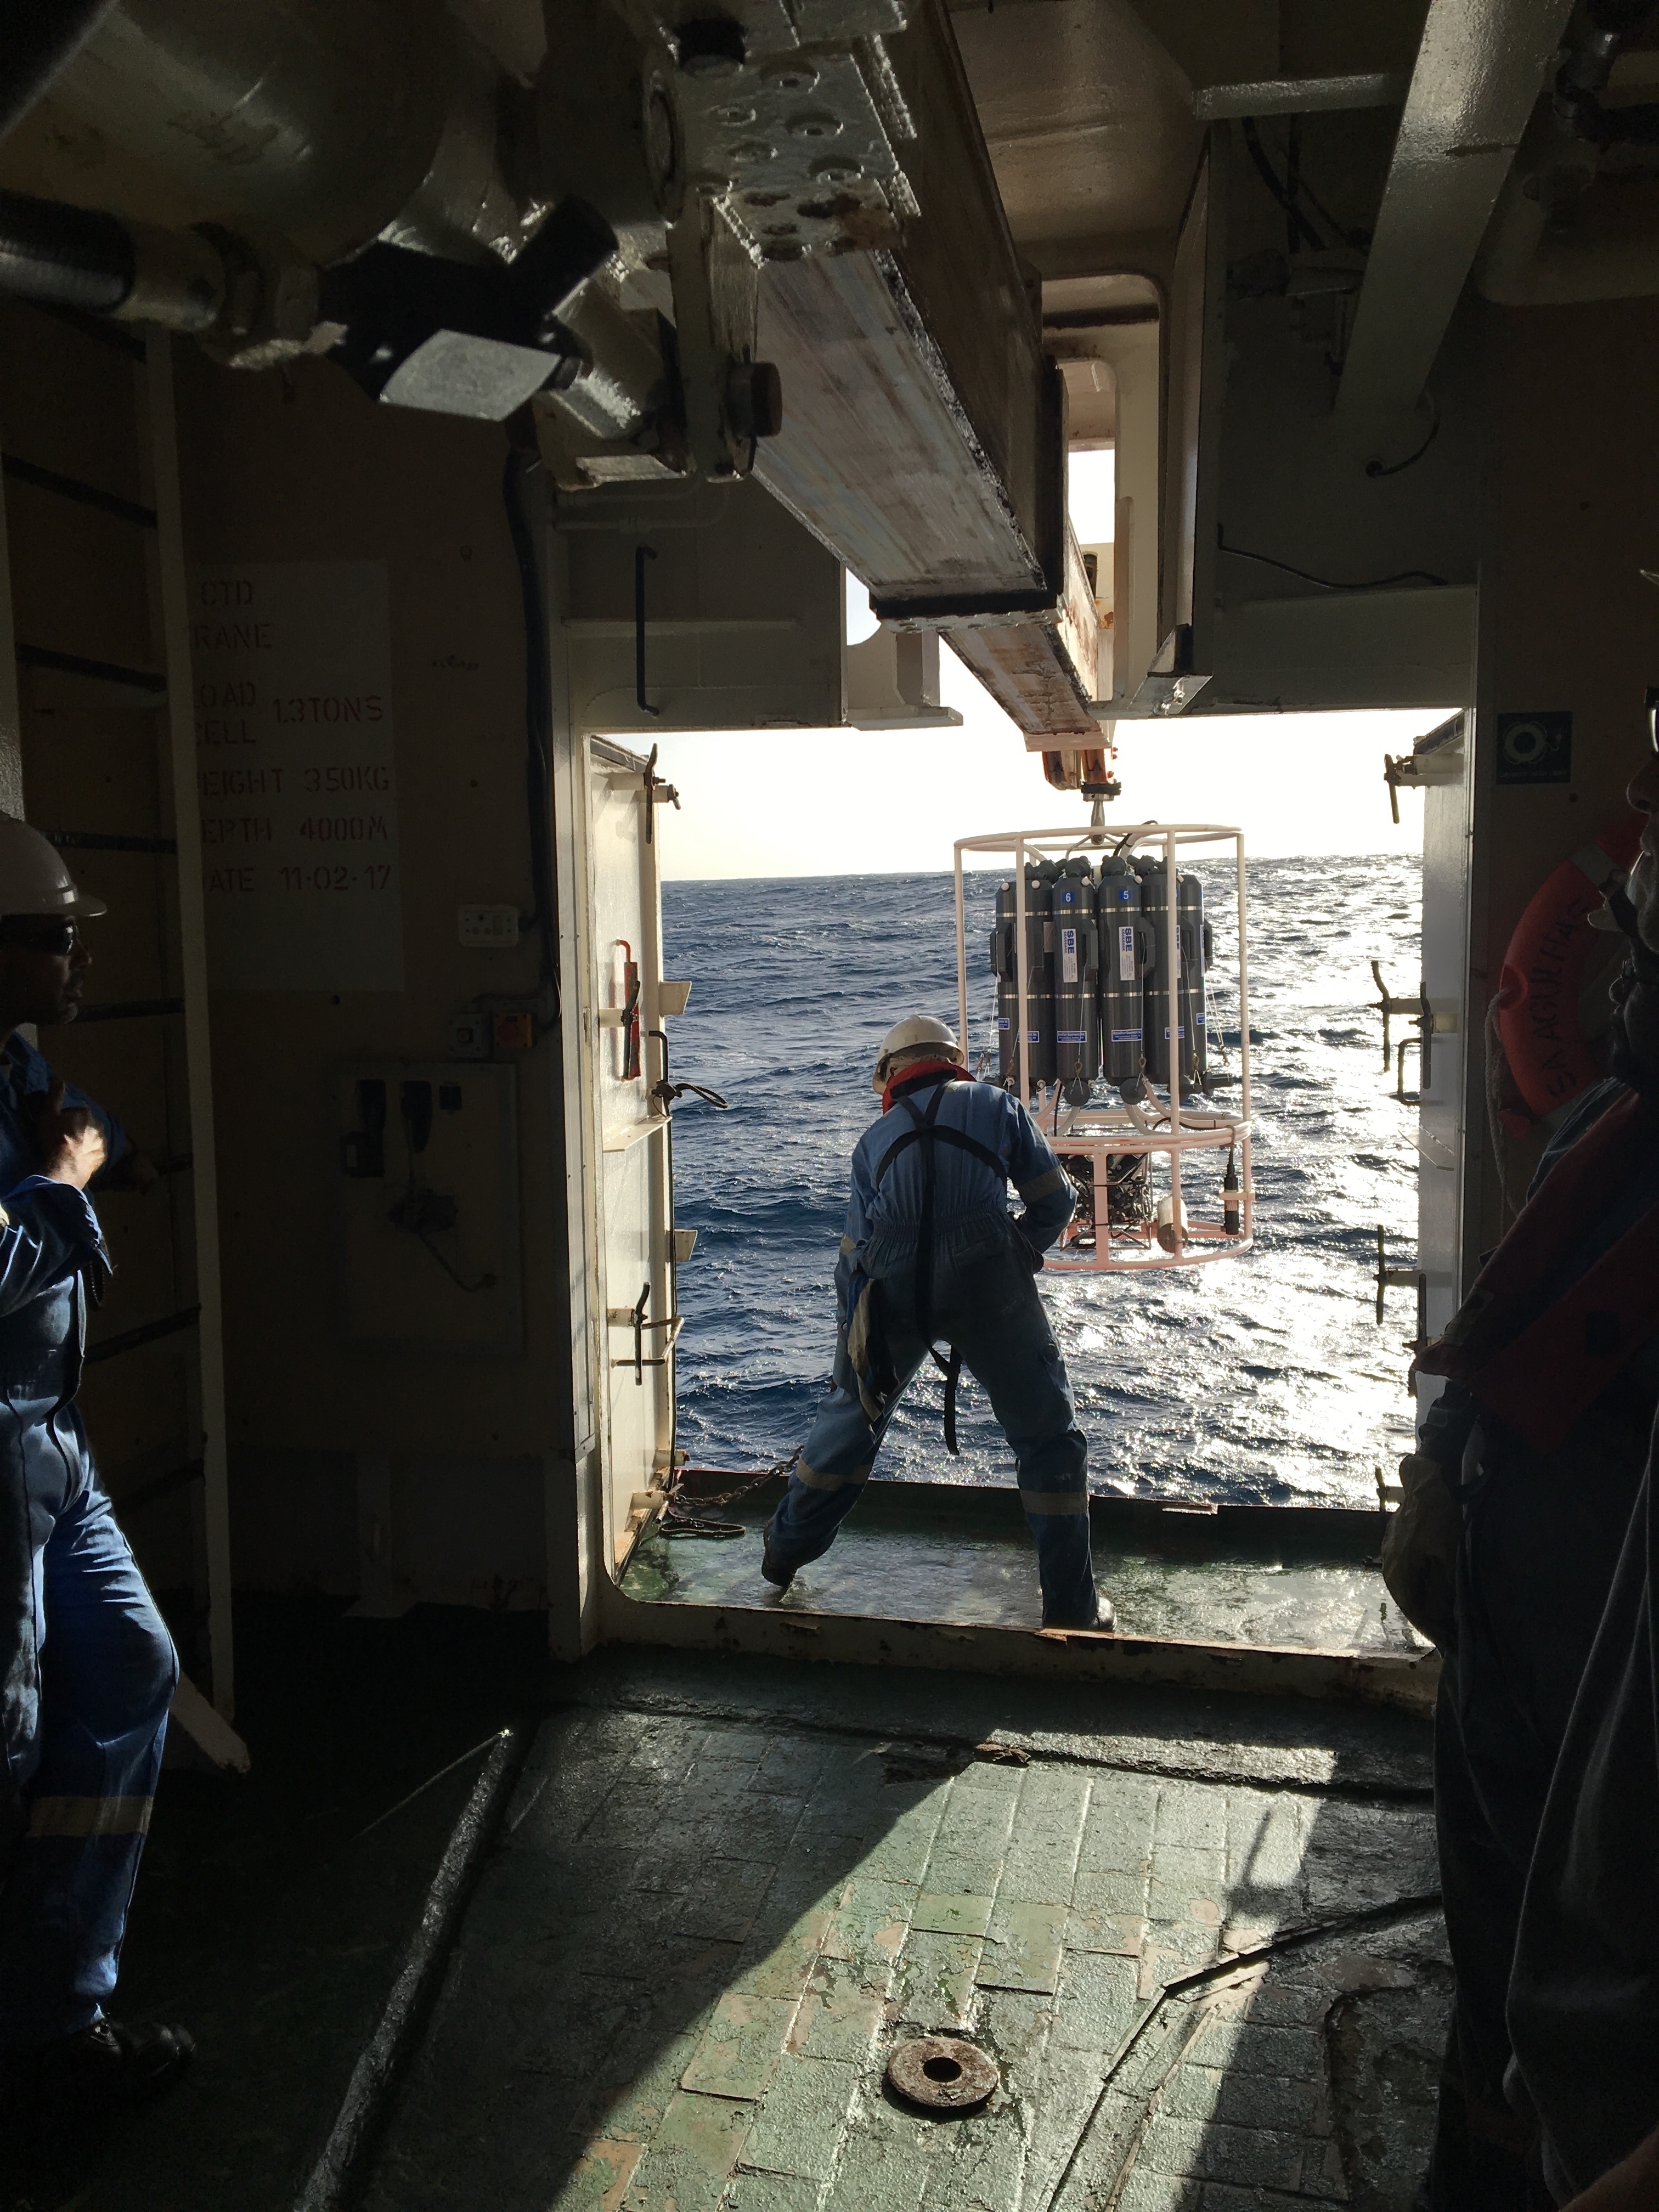
Doing research at sea presents many challenges. One is the weather, which is unpredictable and can make scientific work difficult or impossible. During ASCA, we experienced several days of bad weather that delayed scientific operations.
The test CTD cast on the first day of the June 2018 ASCA cruise was cancelled due to rough weather. Although it is difficult to tell in the picture, wind speeds were approximately 40 knots.
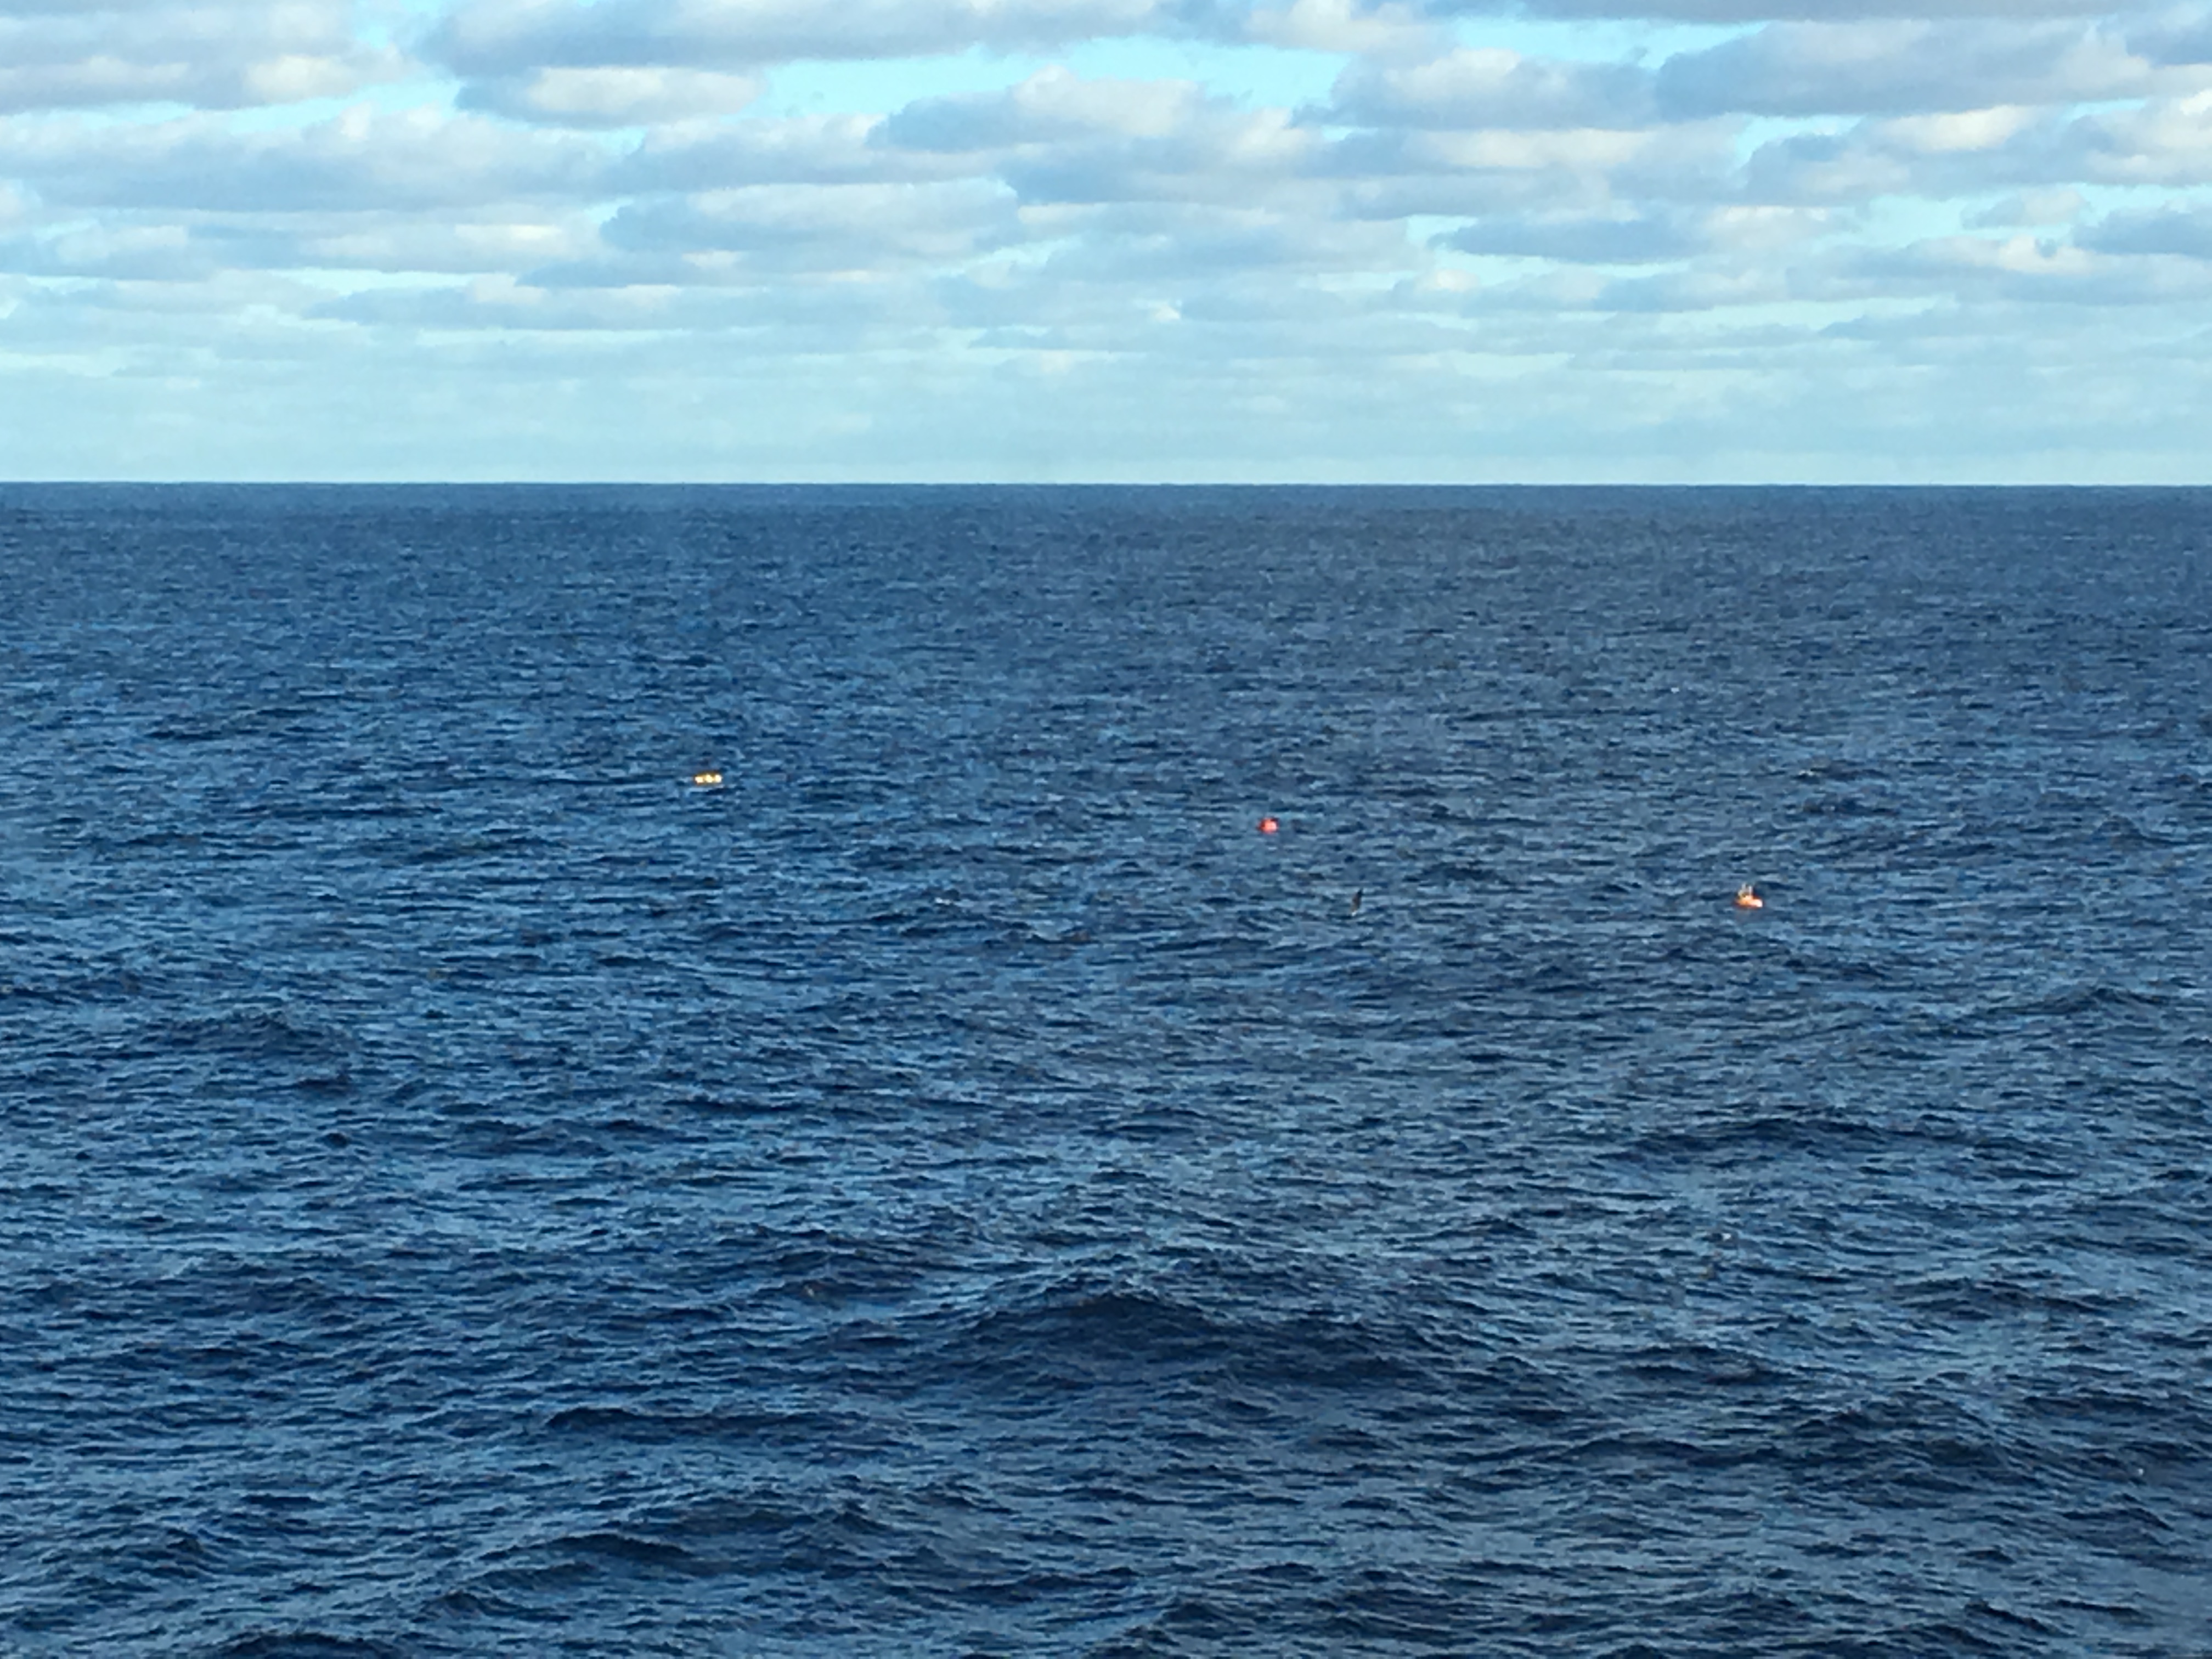
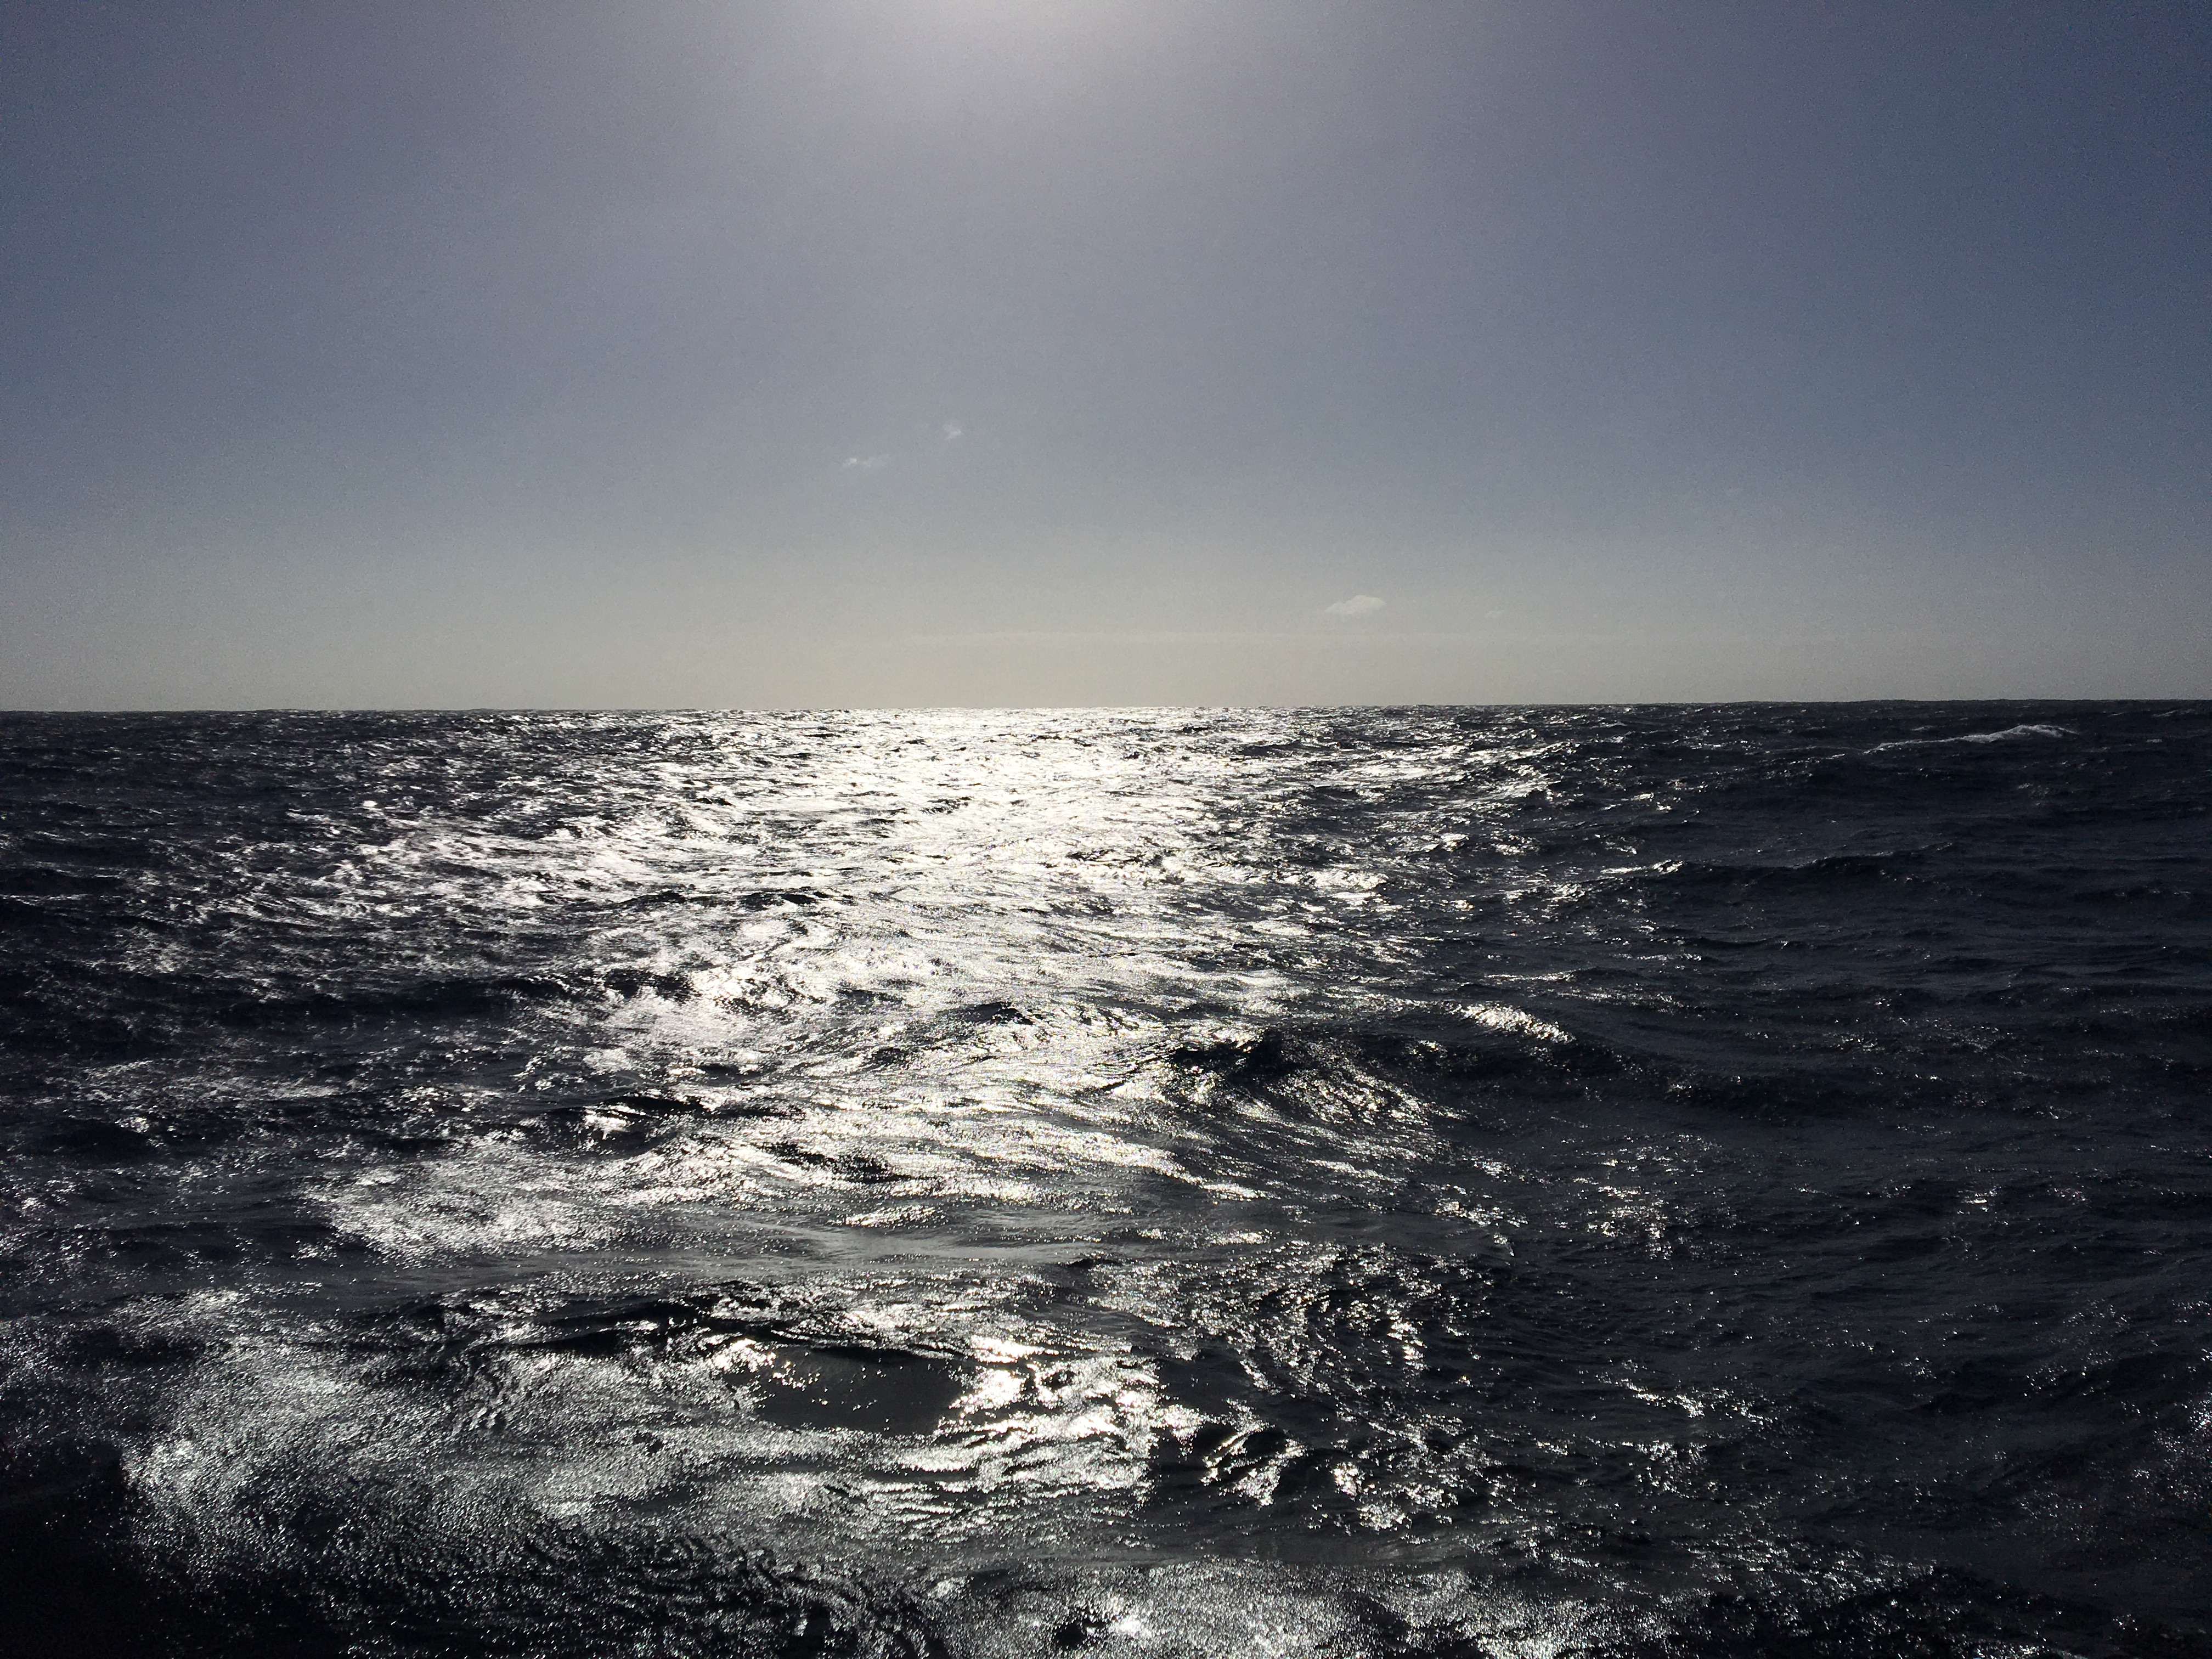
It can be difficult to spot instruments on the surface on the ocean even in perfect conditions, and it is much more difficult if it is hazy, too bright, too dark, or the waves are too large.
Mooring spotting in good conditions. The orange and yellow dots are floats.
Trying to spot a mooring in this glare is very difficult
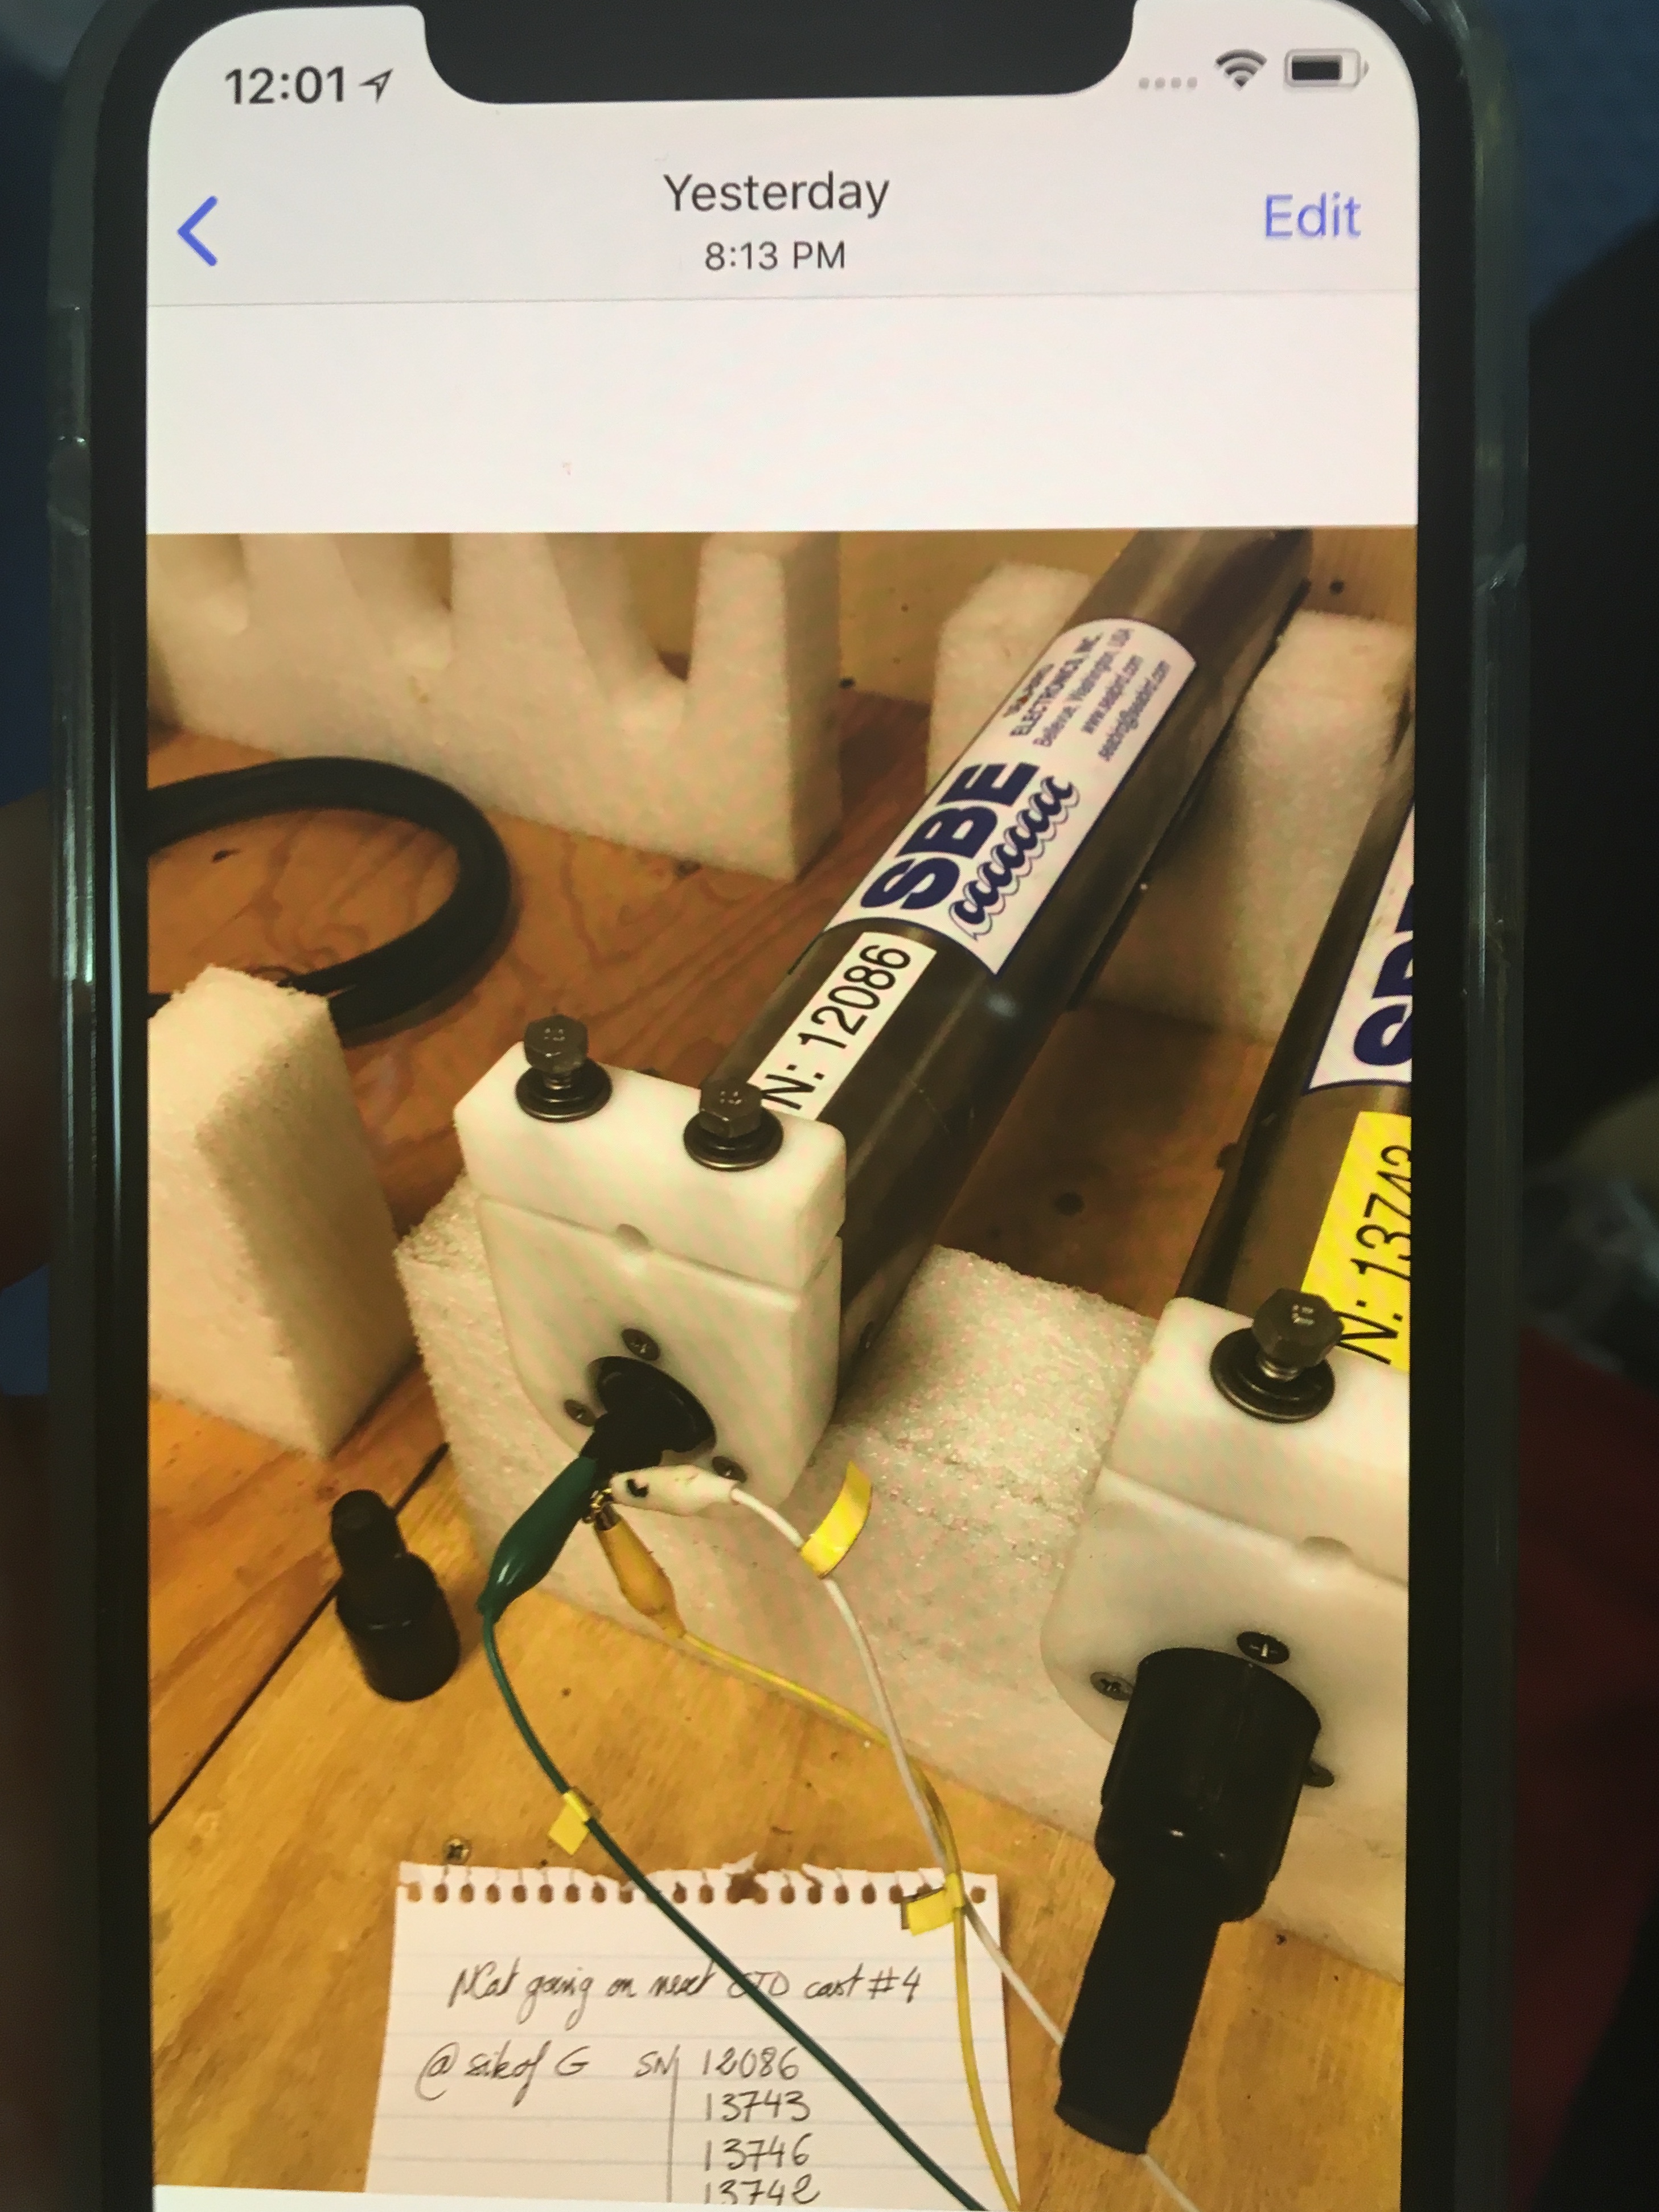
We had very limited to no internet access, which can be a challenging adjustment compared to life on land. Here I resorted to taking a picture of a picture on someone’s iPhone, because we had no other way to send the file. Another difficulty of research at sea: you have to make do with what you have, so alligator clips were fashioned to make up for a forgotten data transfer cable.
Background
The south Indian Ocean transports a large amount of heat southwards: approximately 1 - 1.5 petawatts (PW) (McDonald, 1998; Ganachaud et al., 2000; Lumpkin & Speer, 2007; Talley, 2008; Hernandez-Guerra & Talley, 2016). One PW is equal to 1 x 10¹⁵ watts, or the power of approximately 14 million Boeing 747 airplanes. Some of this heat flows northward into the Atlantic Ocean, and some flows southward into the Southern Ocean. Indian Ocean heat transport is important in controlling the heat content of the basin, which impacts East African rainfall, tropical cyclone activity, and sea level rise (Rouault et al., 2002; Tierney et al., 2013; Rao et al., 2008; Mohino et al., 2011). The Indian Ocean has warmed rapidly in recent years (Cheng et al., 2017), and the heat transport out of the Indian Ocean plays an important role in this full basin heat budget. A better understanding of Indian Ocean heat transport will further our understanding of climate and sea level rise of the Indian Ocean rim.
Although several studies have calculated the time mean heat transport of the south Indian Ocean, the temporal variability of the basin wide heat transport is unknown. We need detailed measurements of the Agulhas Current to properly calculate the time varying Indian Ocean heat transport. As the western boundary current of the South Indian Ocean, the Agulhas Current dominates the heat budget of the basin. This is because the Agulhas Current is strong, warm, and highly variable in time (Beal et al., 2015). The Agulhas System Climate Array collected 26 months of velocity, temperature, conductivity, and sound speed data of the Agulhas Current. Using this data, we will calculate the volume, temperature, and freshwater transport of the current. By combining this data with other data sources such as Argo floats and satellite sea surface height, we can calculate the full basin heat and freshwater transports.
We expect the basin-wide heat transport of the Indian Ocean to be variable in time, and we expect the Agulhas Current will play a large role in this variability. In other regions, heat transport is highly variable in time. For example, in the North Atlantic at 26.5°N, the annual range of heat transport is about 0.7 PW, or almost half the magnitude of the mean heat transport (Johns et al., 2011). If the heat transport of the Indian Ocean is highly variable in time, this may help explain the wide range of previously calculated values of heat transport (from less than 0.25 PW to more than 1.5 PW; Bryden & Beal, 2001; Lumpkin & Speer, 2007).
Several oceanographic circulation features control the value of heat transport. One is the gyre circulation. This is the horizontal circulation consisting of southward transport out of the Indian Ocean via the Agulhas Current, and northward transport into the interior of the Indian Ocean. Since the Agulhas is warmer than the interior of the Indian Ocean, the gyre contributes to a net southward heat transport. The overturning circulation is the vertical cell consisting of northward deep flow into the Indian Ocean, which upwells into intermediate and thermocline waters, and is transported southward out of the Indian Ocean. This contributes to heat transport because the shallower exported water is warmer than the deeper imported water. The gyre contributes a little less than half of the full heat transport, and the overturning circulation contributes to about half of the full heat transport (Talley, 2008). The remaining part of the heat transport is due to the Indonesian Throughflow, which is the current that flows from the Pacific Ocean into the Indian Ocean. These waters are warm when they enter the Indian Ocean, and lose heat while traveling across the Indian Ocean, contributing to a small southward heat transport. ASCA will provide insight into the importance of these mechanisms to the variability of Indian Ocean heat transport.
References:
Beal, L. M., Elipot, S., Houk, A., & Leber, G. M. (2015). Capturing the Transport Variability of a Western Boundary Jet: Results from the Agulhas Current Time-Series Experiment (ACT)*. Journal of Physical Oceanography, 45(5), 1302–1324. http://doi.org/10.1175/JPO-D-14-0119.1
Bryden, H. L., & Beal, L. M. (2001). Role of the Agulhas Current in Indian Ocean circulation and associated heat and freshwater fluxes. Deep-Sea Research Part I: Oceanographic Research Papers, 48(8), 1821–1845. http://doi.org/10.1016/S0967-0637(00)00111-4
Cheng, L., Trenberth, K. E., Fasullo, J., Boyer, T., Abraham, J., & Zhu, J. (2017). Improved estimates of ocean heat content from 1960 to 2015. Science Advances, 1–11. http://doi.org/10.1126/sciadv.1601545
Ganachaud, A., Wunsch, C., Marotzke, J., & Toole, J. (2000). Meridional overturning and large-scale circulation of the Indian Ocean. Journal of Geophysical Research, 105(C11), 26117. http://doi.org/10.1029/2000JC900122
Hernández-guerra, A., & Talley, L. D. (2016). Meridional overturning transports at 30 ° S in the Indian and Pacific Oceans in 2002 – 2003 and 2009. Progress in Oceanography, 146, 89–120. http://doi.org/10.1016/j.pocean.2016.06.005
Johns, W. E., Baringer, M. O., Beal, L. M., Cunningham, S. A., Kanzow, T., Bryden, H. L., … Curry, R. (2011). Continuous, array-based estimates of atlantic ocean heat transport at 26.5°N. Journal of Climate, 24(10), 2429–2449. http://doi.org/10.1175/2010JCLI3997.1
Lumpkin, R., & Speer, K. (2007). Global Ocean Meridional Overturning. J. Phys. Oceanogr., 37(10), 2550–2562. http://doi.org/10.1175/JPO3130.1
Macdonald, A. M. (1998). The global ocean circulation: A hydrographic estimate and regional analysis. Progress in Oceanography, 41(3), 281–382. http://doi.org/10.1016/S0079-6611(98)00020-2
Mohino, E., Janicot, S., & Bader, J. (2011). Sahel rainfall and decadal to multi-decadal sea surface temperature variability. Climate Dynamics, 37, 419–440. http://doi.org/10.1007/s00382-010-0867-2
Rao, V. B., Ferreira, C. C., & Franchito, S. H. (2008). In a changing climate weakening tropical easterly jet induces more violent tropical storms over the north Indian Ocean. Geophysical Research Letters, 35, 2–5. http://doi.org/10.1029/2008GL034729
Rouault, M. (2002). Ocean – Atmosphere Interaction in the Agulhas Current Region and a South African Extreme Weather Event, (Reason 2001), 655–669.
Talley, L. D. (2008). Freshwater transport estimates and the global overturning circulation: Shallow, deep and throughflow components. Progress in Oceanography, 78(4), 257–303. http://doi.org/10.1016/j.pocean.2008.05.001
Tierney, J. E., Smerdon, J. E., Anchukaitis, K. J., & Seager, R. (2013). Multidecadal variability in East African hydroclimate. Nature, 493(7432), 389–392. http://doi.org/10.1038/nature11785